
6. Bank Funding, Liquidity Insurance and Runs
A bank’s funding structure determines who supplies its resources, when those suppliers can ask for repayment and how losses are shared. Deposits, wholesale borrowing, issued securities and equity differ in maturity, stability, information sensitivity and cost. Demand deposits are especially important because they combine a financial claim with a liquidity service: customers can use balances for payments or unexpected consumption rather than waiting for the bank’s loans to mature. That service helps explain why banks can raise some deposits at low interest rates.
The same promise creates fragility. When long-term assets cannot be realised quickly at full value, a rush to withdraw can force costly liquidation. The Diamond–Dybvig framework connects these two sides of banking: deposits can improve the allocation of consumption across uncertain liquidity needs, yet strategic interaction among depositors can produce a destructive run. The analysis also clarifies the different roles of deposit insurance, market discipline and equity capital. Solvency, liquidity and confidence interact, but they are not interchangeable concepts.
The funding mix and how to read its percentages
The historical euro-area balance-sheet series below shows the importance of deposits and a gradual increase in the capital-and-reserves share. Issued debt securities accounted for a smaller share in June 2025 than in 2000. Within deposits, the proportion from monetary financial institutions declined, while the non-MFI share rose. MFI means monetary financial institution and includes monetary authorities under the relevant statistical classification; an MFI deposit is not automatically an unsecured overnight loan from a commercial bank. Statistical categories therefore provide a starting point rather than a complete measure of rollover risk.
| Item | 2000 | 2005 | 2010 | 2020 | June 2025 |
|---|---|---|---|---|---|
| Deposits | 54% | 52% | 51% | 60% | 58% |
| Of deposits: MFIs | 41% | 40% | 35% | 33% | 30% |
| Of deposits: central government | 1% | 1% | 1% | 1% | 3% |
| Of deposits: non-MFIs | 58% | 59% | 64% | 66% | 66% |
| Debt securities issued | 16% | 16% | 15% | 10% | 11% |
| Other liabilities | 24% | 26% | 27% | 23% | 24% |
| Capital and reserves | 5.6% | 5.6% | 6.3% | 7.1% | 7.1% |
| Balance-sheet total, EUR billion | 16,662 | 23,635 | 32,207 | 35,930 | 41,383 |
The three “of deposits” rows use total deposits as their denominator, not total assets. For June 2025, MFI deposits are approximately of total assets, rather than 30%. Rounding explains why some displayed shares do not sum exactly to 100. “Capital and reserves” in this statistical balance sheet is not identical to a regulatory CET1 ratio, which uses an eligible-capital numerator and a risk-weighted denominator. The total includes the capital side of the balance sheet and should not be interpreted as debt excluding equity.
Funding stability depends on more than the legal label. A diversified base of small transactional accounts behaves differently from a few large uninsured balances that can be moved rapidly. Term debt reduces near-term rollover needs but still has maturity dates; secured borrowing depends on collateral values and haircuts. A funding analysis should match contractual cash outflows and realistic behavioural assumptions with asset liquidity, rather than assume that every deposit will remain or that every maturing liability can be refinanced.
Historical ECB-based figures, with the observation dates stated explicitly. The underlying statistical context is ECB money, credit and banking statistics.
The deposit contract and sequential service
A standard demand deposit is a debt claim on the bank, normally not a traded security, that the customer can withdraw or transfer on demand under the account terms. Its liquidity distinguishes it from a locked term claim. Sequential service means that the bank honours requests in the order they arrive while resources remain. In the simple bank-run model, an early claimant can receive the full promised amount while a later claimant receives less or nothing. This contractual timing creates an incentive to act before others when the depositor fears a shortfall.
The model should not be mistaken for a complete description of modern insolvency law. Deposit insurance, intervention powers, suspension of payments and creditor-priority rules change what happens when a bank actually fails. Nevertheless, ordinary withdrawal before closure can confer an advantage over leaving an exposed balance in place. Digital transfers can produce the economic equivalent of a queue without anyone standing outside a branch. A deposit can be behaviourally stable in normal times while remaining legally callable at short notice.
A three-date model of uncertain consumption needs
Consider 100 households, each with USD 100 at date . Exactly 40 will need consumption at and 60 at , but no household initially knows its own type. At the individual level, the probabilities are therefore 0.4 and 0.6. The known aggregate split isolates idiosyncratic liquidity risk; if aggregate withdrawals were uncertain, the bank would need to consider additional buffers or contingent arrangements. A household’s realised type is private information, so a late consumer can request early withdrawal even when it has no immediate need to consume.
Each long-term project costs USD 100 at date 0, yields USD 225 at date 2 and can instead be liquidated for USD 81 at date 1. Cash storage preserves one dollar as one dollar between dates. The project has no uncertainty about its mature payoff in this illustration: the loss comes from liquidation before maturity, not from borrower default. Projects are treated as divisible when calculating marginal liquidation. The values are stylised teaching assumptions, not representative market returns.
Early consumers value only date-1 consumption and late consumers only date-2 consumption. Their utilities are:
The two factors of 0.6 have different meanings: one is the probability of being late, the other is the preference weight on late consumption. Combining them gives . The square root makes utility concave, so a dollar provides more additional utility when consumption is low. The appropriate welfare comparison is ex ante, before the household learns its liquidity type. Comparing the larger of two cash payments alone misses the value of insurance.
Direct investment without a bank
A household storing all USD 100 can consume USD 100 in either state. Its early utility is 10 and its late utility is , so expected utility is . A household investing all USD 100 must liquidate for USD 81 if early, but receives USD 225 if late. Both state utilities happen to equal 9: and . Expected utility is therefore 9, making direct investment preferable to pure storage.
Allowing a household to split its own savings does not overturn this ranking under these numbers. If a fraction is stored and the rest invested, early consumption is and late consumption . Expected utility is . Its derivative is negative at and becomes more negative as storage increases, so the maximum is at . The isolated household invests entirely and liquidates if it turns out to be early. The bank’s advantage will therefore arise from pooling different households’ needs, not merely from offering a portfolio allocation an individual already could achieve.
Pooling liquidity needs and preserving long-term projects
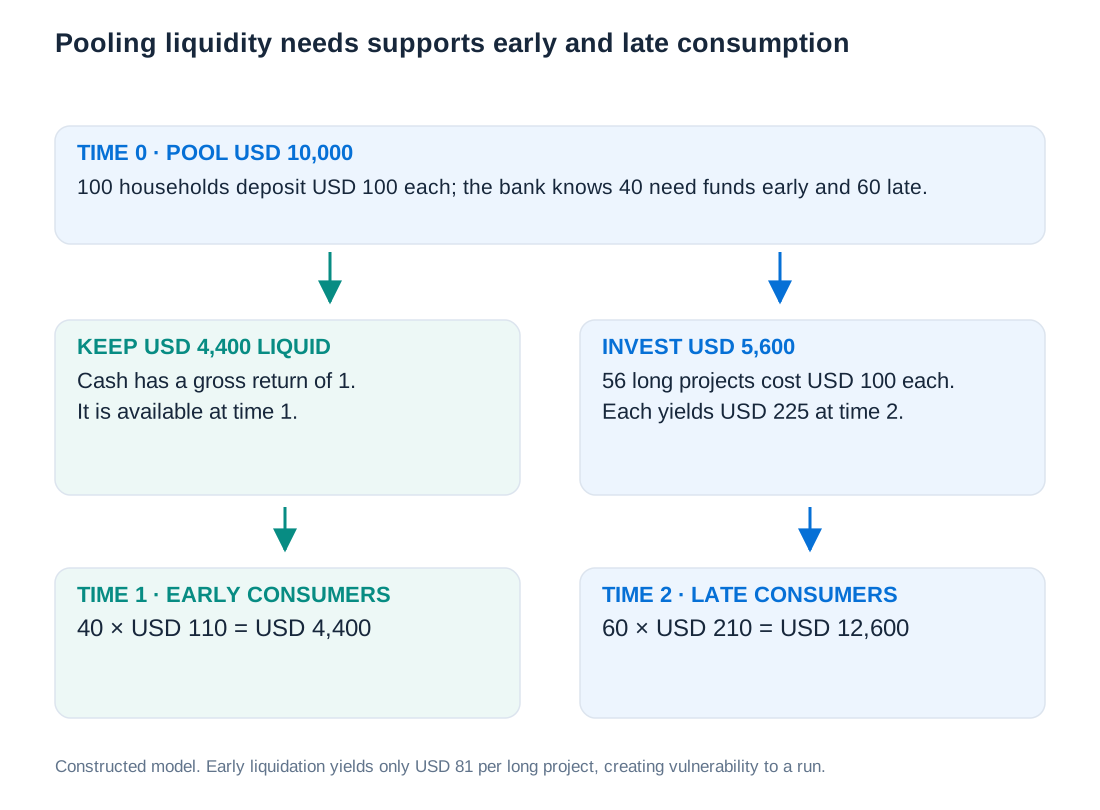
A bank receiving all USD 10,000 can offer USD 100 to each early consumer and USD 225 to each late consumer without liquidating projects. It stores dollars and invests the remaining USD 6,000 in 60 projects. At date 1, the cash covers all 40 early withdrawals. At date 2, the projects yield dollars, exactly enough for in late payments. The bank does not create extra resources; it avoids forcing each early household to liquidate its own project.
Expected utility becomes , exceeding the direct-investment value of 9. Early consumers receive more than the liquidation value, while late consumers retain the full mature payoff. Pooling allows some money to be held safely for those who will need it early and the remaining projects to survive to maturity. This allocation assumes late consumers wait and the aggregate need is as predicted.
The bank can also smooth consumption more strongly. Offer and . Holding dollars in cash leaves USD 5,600 to finance 56 projects. Their date-2 proceeds are , which pay . Early consumption rises by 10 while late consumption falls by 15. The ex ante welfare effect is positive because of the assumed marginal utilities and the resource cost of shifting funds between the two dates:
| Arrangement | Early consumption | Late consumption | Initial projects financed | Expected utility |
|---|---|---|---|---|
| Individual cash storage | USD 100 | USD 100 | 0 | 7.6000 |
| Individual project investment | USD 81 | USD 225 | 100, of which 40 liquidated | 9.0000 |
| Pooling without extra smoothing | USD 100 | USD 225 | 60, none liquidated | 9.4000 |
| Pooling with smoothing | USD 110 | USD 210 | 56, none liquidated | 9.4121 |
Financial intermediation does not always increase the number of projects initially financed. Here it reduces investment from 100 projects to 56 while increasing welfare. In direct investment, 40 projects are subsequently destroyed early; in the pooling arrangement, liquid resources are planned from the outset and consumption is better allocated across states. Investment volume alone is therefore not a sufficient measure of the bank’s contribution.
The resource constraint and the exact smoothing optimum
The USD 110/210 contract is a convenient feasible improvement, not the exact optimum. To derive the latter, let the bank hold enough cash for early payments and put everything else into projects. With 40 early and 60 late households, the budget is:
One extra dollar to each early household costs USD 40 in cash and forgoes USD 90 of mature project proceeds, reducing each of 60 late payments by USD 1.50. Maximising yields:
Solving both conditions gives , and expected utility approximately 9.412757. This assumes divisible projects and the stated preferences. Since , a late household prefers waiting to withdrawing and storing the money, provided other late households also wait. The tiny improvement over USD 110/210 explains why the rounded contract is useful without mislabelling it as the exact mathematical solution.
The economic framework originates in Diamond and Dybvig, Bank Runs, Deposit Insurance, and Liquidity (1983). The numerical model here is the specified 100-household illustration, with its feasibility and utility calculations shown explicitly.
The no-run equilibrium
Return to the USD 110/210 contract. A late household’s payoff depends on other households’ withdrawal decisions. If all other late households wait, the bank uses its USD 4,400 cash for the 40 early consumers and keeps all 56 projects until maturity. A particular late household, X, then receives USD 210 at date 2 and utility . If X instead withdraws at date 1, it receives USD 110, stores that amount until date 2 and obtains utility .
That extra withdrawal forces liquidation of projects once the normal cash buffer is exhausted. X still prefers waiting because USD 210 exceeds the USD 110 it could store. Since the same reasoning applies to every late depositor when the others wait, no early withdrawal by late consumers is a Nash equilibrium. A Nash equilibrium means no individual benefits from changing its action while all others keep theirs; it does not mean the outcome is guaranteed to occur.
The run equilibrium and the cost of being last
Now suppose X expects the other 59 late consumers to withdraw early together with the 40 genuinely early consumers. Those 99 withdrawals request dollars. Liquidating every project produces only dollars; including cash, total liquid resources are . The bank cannot honour the promised early amount to everyone even though its investments would have yielded enough to support the intended allocation if left intact.
If X waits, the 99 other customers exhaust all liquid resources and no projects remain, so X receives zero at date 2. If X joins the run, all 100 customers queue. Under sequential service the first 81 receive USD 110 each, consuming USD 8,910; the 82nd receives the remaining USD 26; the final 18 receive zero. Assuming each place is equally likely, X’s expected cash receipt is:
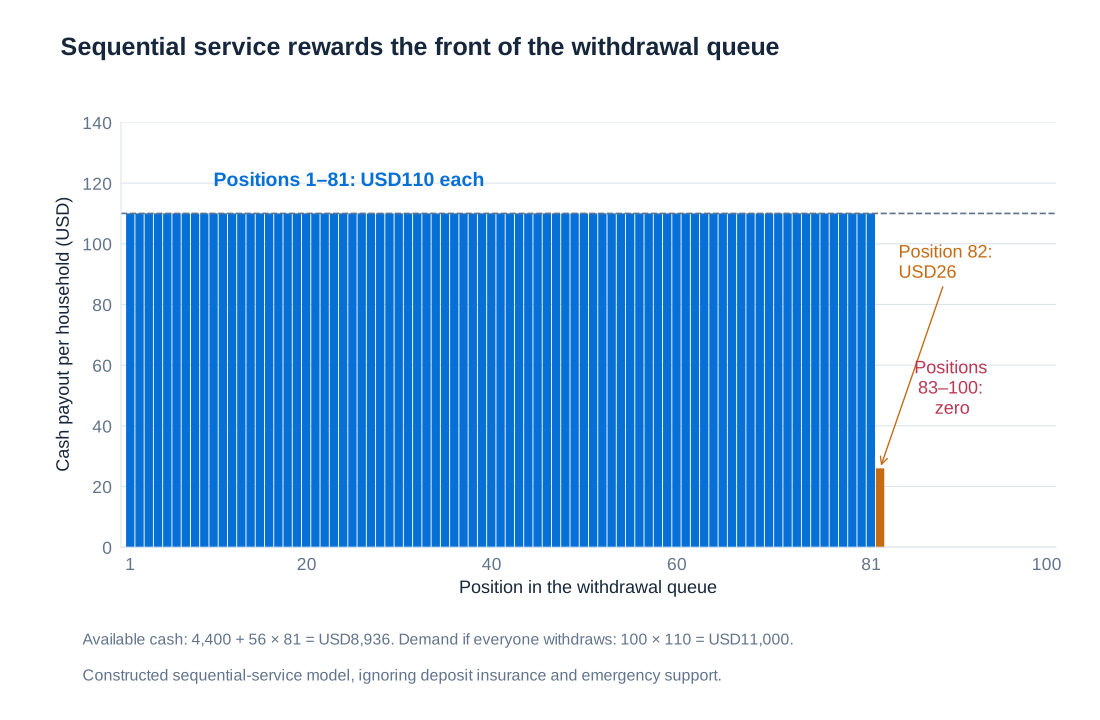
Because X is risk averse, expected utility must be calculated state by state. Applying utility to the average payout gives the wrong answer. The correct expected utility from running and storing the receipt is:
This is below , the utility of a certain USD 89.36, because the queue exposes X to payout risk. It nevertheless exceeds the zero utility from waiting when everyone else runs. Joining is therefore a best response, making the run another equilibrium. Individually rational actions can destroy collectively valuable liquidity insurance. “Panic” describes the adverse coordination outcome, not a proof that every depositor behaves irrationally.
The model isolates a run triggered by expectations without an initial deterioration in project fundamentals. In practice, runs can also reveal genuine insolvency, react to interest-rate losses or combine fundamental concerns with coordination effects. The distinction matters for intervention: providing liquidity to a viable bank and absorbing losses at an insolvent one solve different problems.
Deposit insurance, equal treatment and their limits
Suppose an external insurance scheme guarantees each depositor at least USD 100, with credible resources and timely payment. If X waits while everyone else runs, it receives USD 100 from the insurer rather than zero, giving utility 6. If X joins, the first 81 queue positions still receive USD 110; all other positions are topped up to USD 100. Expected utility from joining is then . Insurance greatly reduces the downside of waiting, but this particular principal-only guarantee does not eliminate the incentive to run, because it protects 100 while an early successful withdrawal pays 110.
A stronger guarantee or different contract can remove the first-mover advantage if waiting preserves at least the relevant insured entitlement and payment is sufficiently prompt. Credibility, coverage limits and access to funds matter as much as the announcement of insurance. Protection financed from outside the failing bank also changes the resource constraint: the insurer’s payment cannot be treated as cash the original bank created. By weakening creditors’ incentives to monitor risk, insurance can increase moral hazard, which is why capital requirements, supervision, risk-sensitive charges and resolution arrangements are relevant complements.
Alternatively, imagine that liquidation proceeds must be shared equally among all 100 depositors, independently of who sought early payment. Each receives dollars. X then obtains the same cash amount by joining or waiting, removing the advantage of a better queue position under that rule. It does not restore the USD 210 late payment or recover the productive value destroyed by liquidation. The result is indifference, not a strict proof that no run can occur. Actual legal equal treatment after closure also need not reverse payments already made before intervention.
Northern Rock and observable depositor behaviour
The Northern Rock queues in 2007 provide a visible illustration of these incentives. Customers’ concerns included whether other customers would withdraw, whether branch service would stop and whether being late would leave them without access to funds. Some described moving money as a prudent response to others’ actions rather than as panic. This resembles the model’s strategic complementarity: another depositor’s withdrawal can make one’s own withdrawal more attractive. The photograph is evidence of the historical event, while the numerical model is a constructed explanation of one mechanism.

The episode should not be reduced to a pure belief shock. A real bank’s wholesale funding, asset liquidity, public support and information about its condition also matter. Visible queues can amplify existing concerns; online communication and rapid transfers can now spread and implement withdrawal decisions much faster. Payment interruption can motivate even an insured customer to move funds, so withdrawal alone does not reveal that a customer expects an uninsured ultimate loss.
Demand deposits versus locked term funding: a worked choice
A customer with USD 100 can choose a demand account paying 10% annually or a two-year term deposit paying 20% annually. Interest compounds and is paid on withdrawal or maturity. The demand account pays USD 110 after one year or USD 121 after two. The term account pays USD 144 after two years and cannot be withdrawn early. Keep the same 40% early/60% late type probabilities and the same utilities. Assume the customer cannot borrow against or sell the term claim; an early consumer obtains no date-1 consumption from it and assigns no value to its later payoff.
The two expected utilities are:
The customer prefers the lower-interest demand account because its early availability is valuable. The term deposit would need terminal payoff satisfying . Thus dollars. If is the annually compounded rate on the two-year term deposit, then:
Intermediate rounding matters: replacing the exact demand utility with 8.16 before solving changes the reported payoff and rate. The enormous break-even rate is not a realistic market estimate. It results from an extreme assumption that an early household cannot use the locked wealth at all and cares exclusively about early consumption. The exercise isolates a general insight: liquidity services can make demand funding cheaper than otherwise comparable locked funding. Removing the borrowing or withdrawal restriction, changing the type probabilities, adding risk or account services would change the premium.
Market discipline: useful monitoring and destabilising withdrawal
Market discipline occurs when investors or creditors react to bank risk through required returns, funding quantities and contractual terms, thereby influencing management before losses occur. Callable deposits give a creditor an exit option. If risky behaviour threatens funding, managers may limit that behaviour ex ante. Uninsured short-term wholesale creditors, including interbank lenders and money-market funds, have stronger direct loss incentives to monitor than fully protected small depositors. Equity and long-term debt prices also contain information, even when those investors cannot withdraw at par.
Discipline is neither automatic nor costless. Monitoring requires information and expertise; some creditors may free-ride on others, rely on guarantees or react to misleading signals. Withdrawal can punish a weak bank but also force inefficient asset sales and spread stress. A model in which the credible threat of withdrawal induces safe behaviour can explain demandable debt, but it does not establish that real-world deposits are inherently risk-free. The same mechanism can discipline managers and create an unstable coordination game.
Pillar 3 of the Basel framework supports discipline through public disclosure, complementing minimum requirements and supervisory review. Useful information enables investors to compare exposures, capital and risk, but disclosure cannot make all investors equally informed or prevent every run. Deposit insurance and the removal of sequential priority reduce the private benefit from monitoring through withdrawal; prudential oversight then has a larger role in constraining risk.
Empirical work finds that deposit outflows depend on bank distress, uninsured exposure and the customer relationship. Brown, Guin and Morkoetter’s study of the 2007–09 crisis finds lower withdrawal risk among clients with strong pre-existing relationships and higher switching costs. The finding is about the studied setting, not a guarantee that relationship deposits never leave. Research by Jiang, Matvos, Piskorski and Seru links interest-rate-related asset-value losses and uninsured leverage to fragility in 2023. Work by Cookson and co-authors examines how social media can accelerate coordination. Motives may include loss avoidance, uninterrupted payment access, better interest rates or disapproval of the institution; observed withdrawals need not arise from a single motive.
Sources: Basel Pillar 3 disclosure framework; Brown, Guin and Morkoetter, Deposit withdrawals from distressed banks: Client relationships matter; Jiang and co-authors, Monetary Tightening and U.S. Bank Fragility in 2023; Cookson and co-authors, Social media as a bank run catalyst.
Modigliani–Miller as a benchmark for bank capital structure
A bank’s capital structure is the combination of debt and equity financing its assets. Under the frictionless Modigliani–Miller benchmark, changing that combination does not change total firm value if the underlying investment policy and total cash flows remain fixed. Perfect-market assumptions remove transaction costs, financing-dependent taxes, additional distress costs, information asymmetries and financing effects on investment. Debt can be risky in an extended version of the argument; what is excluded is an extra destruction of value merely from dividing the cash flows differently.
If a bank reduces leverage, its equity generally becomes less risky, so the return shareholders require can fall. It is therefore incorrect to multiply a fixed historical equity return by a higher equity share and infer that total financing costs must rise by that amount. The theorem provides a disciplined benchmark, not a literal description of banking: deposits provide services, guarantees create subsidies, taxes treat instruments differently and distress can destroy value. These departures explain why capital structure matters in practice. The classic cost-of-capital paper is from 1958; it should not be confused with the later dividend-policy work.


The trade-off theory and differences in asset risk
Trade-off theory balances benefits of debt, such as an interest tax shield where available, against expected costs of financial distress and related agency problems. Holding other factors constant, lower asset risk permits more debt for a given likelihood of distress. A bank’s diversified portfolio of cash, securities and senior loans can have lower measured asset volatility than the operating assets of a non-financial company. A loan is often a comparatively protected claim on a business, whereas the business’s own assets bear the full operating uncertainty.
This helps explain why banks often have greater leverage than non-financial firms; it does not establish that every bank has safer assets than every company. Concentrated lending, correlated defaults, market positions, duration exposure and off-balance-sheet commitments can all make a bank risky. Low volatility measured during normal periods may also conceal tail risk. Evidence on average differences in asset risk therefore supports a conditional explanation of leverage, not a blanket endorsement of a thin equity buffer.
Liquidity production and the special role of bank debt
Ordinary corporate debt primarily finances a firm. Bank deposits also produce services that customers value: payments, safekeeping and access to liquidity at short notice. Depositors may accept a lower yield in exchange for these services, creating a convenience benefit for the bank. Under liquidity-production theories, risk management helps the institution issue liabilities that users regard as safe and liquid. Replacing every deposit with ordinary equity would eliminate the deposit service, because an equity claim fluctuates in value and is not a promise to pay a fixed amount on demand.
That observation does not imply that any additional equity destroys liquidity creation. The bank can replace other debt, retain earnings or change its scale, and stronger capital can make deposits safer. The relevant question is the marginal effect of a financing change under explicit assumptions about assets, services, risk and regulation. Models in which high leverage supports liquidity production explain one force favouring debt; they do not by themselves identify the socially optimal capital ratio.
Discipline and the government safety net
A second bank-specific theory treats demandable short-term debt as a commitment device. Creditors can withdraw when they observe managerial diversion or risk taking, making misconduct costly to the bank. The threat can support prudent conduct in the model, provided monitoring and enforcement are effective. It is a theoretical explanation for why banks issue runnable debt even though runs are costly; the tension cannot be resolved by assuming the run threat has benefits but no possible costs.
A third explanation is the public safety net: deposit guarantees, access to central-bank liquidity and the expectation of extraordinary support can reduce creditors’ required compensation for risk. If the price of protection does not fully reflect risk, shareholders may prefer more leverage because part of the downside falls on the insurer, a resolution fund or ultimately the public. This creates a difference between privately attractive funding and socially desirable funding. It does not follow that every central-bank loan is a taxpayer subsidy or that every failed bank will be rescued: collateral, pricing, eligibility, loss allocation and resolution rules matter.
| Explanation | Mechanism | Implication and qualification |
|---|---|---|
| Modigliani–Miller benchmark | Financing only reallocates fixed cash flows | No value effect under its assumptions; real frictions must explain a difference |
| Trade-off theory | Debt benefits balanced against expected distress costs | Lower asset risk can support greater leverage |
| Liquidity production | Deposits supply valuable liquid claims | Some debt is an output of banking, but extra equity need not eliminate deposits |
| Market discipline | Withdrawal threats constrain managerial behaviour | Demandability can create incentives and also destructive runs |
| Safety-net incentives | Protection lowers private creditor exposure to loss | Private leverage can exceed the socially desirable level |
What empirical evidence can and cannot establish
Research comparing banks and non-banks finds that asset-risk differences explain a substantial part of their leverage difference. The remaining difference should not simply be labelled a precisely measured government subsidy: liquidity services, regulation, measurement and other institutional features can also matter. Likewise, evidence that historical capital ratios are weak predictors of crisis onset does not prove that leverage is harmless. Asset booms, funding composition, changes in asset risk and valuation losses can interact with the size of the loss-absorbing buffer.
The distinction between entering and recovering from a crisis is useful. Jordà, Richter, Schularick and Taylor’s historical work finds that better-capitalised banking systems recover more successfully after crises, even though high capital alone is not a reliable predictor of which systems will avoid one. A weakly capitalised bank suffering losses may cut lending or sell assets to restore a ratio, transmitting stress to borrowers. Capital absorbs losses and can support continued intermediation precisely when raising fresh equity is difficult.
Higher capital requirements can have short-run transition costs. Gropp, Mosk, Ongena and Wix’s analysis of the 2011 European capital exercise finds that affected banks increased ratios importantly by reducing risk-weighted assets and lending, with adverse effects on dependent firms. This identifies a response to a particular intervention, not a universal permanent effect of higher capital. Banks can also adjust through new equity, retained earnings or a different asset mix; timing and economic conditions influence which route they choose. A policy assessment must compare transition effects with the benefits of greater resilience and more stable lending over the cycle.
Empirical references include Berg and Gider (2017), What Explains the Difference in Leverage between Banks and Non-Banks?; Jordà, Richter, Schularick and Taylor, Bank Capital Redux: Solvency, Liquidity, and Crisis; and Gropp, Mosk, Ongena and Wix, Banks Response to Higher Capital Requirements. The mechanisms of liquidity production and demandable debt are developed respectively by DeAngelo and Stulz (2015) and Calomiris and Kahn (1991); the safety-net debate includes Admati and Hellwig (2013).
The funding decision therefore cannot be reduced to choosing the cheapest quoted interest rate. A bank must consider liquidity services promised to customers, the assets backing those promises, the incentives created by withdrawal rights and the losses its equity can absorb. A structure that is inexpensive in normal times can become costly when creditors demand cash simultaneously, while an adequate capital buffer and credible liquidity arrangements help preserve the services for which customers use the bank.