
11. Innovation and Competition in Payments
Payments are a financial service, a technology business and a coordination problem. Customers want a convenient and trustworthy way to pay; merchants want completed sales at an acceptable cost; providers need enough revenue to finance infrastructure, fraud control and support. The same transaction can involve a wallet, a card scheme, an acquiring bank, an issuing bank and central-bank settlement. Innovation can improve one layer without replacing the others, which is why a familiar bank account can remain behind a new customer-facing application.
The layers of a payment service
The interface determines how a person initiates a payment, whether with a card, application, QR code or online checkout. Authentication establishes who is authorising it. Messaging communicates the instruction; clearing calculates obligations; settlement discharges them using an agreed asset. Merchant acceptance, compliance, dispute handling and customer service connect these layers to real commercial activity. A provider may specialise in one function or integrate several.
Consider a mobile wallet that tokenises a customer's existing card credentials. The consumer may experience a new and convenient product, while the payment continues to use a card network and a bank account. Consequently, wallet use and card use can overlap. They must not be added as if they were mutually exclusive payment categories. An account-to-account service can instead initiate a credit transfer, but still needs authentication, fraud controls and merchant reconciliation.
| Layer | Economic role | Example of a relevant performance measure |
|---|---|---|
| Customer interface | Make payment initiation convenient and accessible | Checkout completion, time and accessibility |
| Authentication and risk control | Limit unauthorised use and fraud | Fraud losses, false declines and recovery |
| Acceptance and scheme rules | Connect payers and merchants under shared rules | Active acceptance, coverage and interoperability |
| Clearing and settlement | Determine and discharge financial obligations | Finality, liquidity use, uptime and settlement failures |
| Post-payment services | Resolve disputes and reconcile transactions | Resolution time, refund handling and support cost |
| Credit and value-added services | Provide financing, loyalty or other complementary services | Incremental benefit after credit losses and service costs |
Two-sided markets and cross-side network effects
A payment platform usually serves at least two interdependent groups. Consumers value a method more when many merchants accept it; merchants value it more when many customers actively use it. These are cross-side, or indirect, network effects. Direct network effects instead arise when users benefit from other members of the same group, as with person-to-person messaging or transfers. Both can exist in a payment ecosystem, but they are analytically distinct.
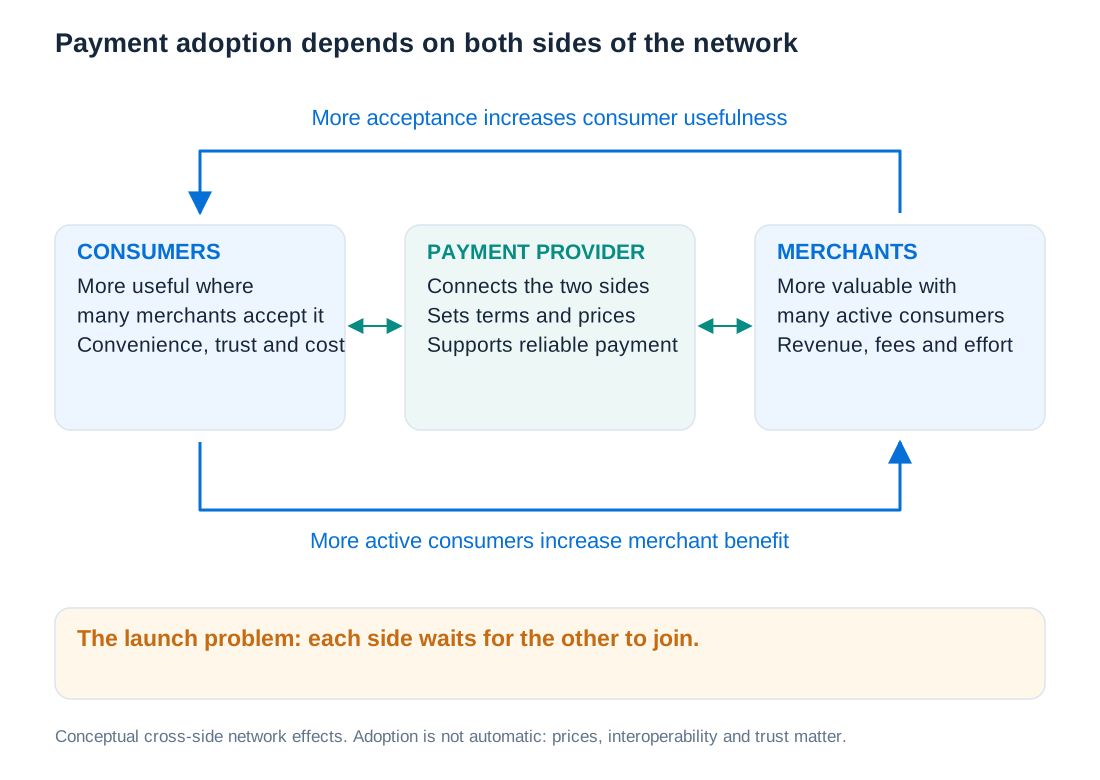
A technically excellent method with few accepting merchants gives consumers little reason to adopt. Merchants, in turn, may refuse integration until consumer demand exists. This coordination problem explains why a new platform may subsidise one side, recruit anchor merchants or integrate into an application with an existing user base. It also explains why charging each side its narrowly measured processing cost need not maximise adoption or profit.
A simple representation is , where consumer utility rises with the number of relevant merchants , falls with the consumer price , and falls with adoption frictions . Merchant benefit can similarly be written . The parameters and capture cross-side benefits in a stylised model, not estimated universal constants. The relevant counts are usable, active counterparties rather than every registered account worldwide. A high nominal user count can be commercially unhelpful if those users never select the method.
Positive feedback can make established networks difficult to displace, but concentration is not inevitable. Consumers and merchants can multi-home, using several providers, and interoperability can connect networks. Switching costs, exclusive arrangements, default settings, device access and the cost of integrating additional methods affect competitive pressure. Network effects and economies of scale are also different: network effects change the value of participation, whereas economies of scale reduce average cost as output increases.
Solving a customer problem before pursuing scale
Successful innovation removes a specific friction. Early e-commerce created problems of trust, repeated data entry, unfamiliar merchants and abandoned checkout. A wallet that simplifies payment and provides credible dispute handling can create value without inventing a new settlement asset. A merchant may accept a higher fee if the service brings additional profitable sales, reduces fraud or improves reconciliation. The gain must be measured against an appropriate alternative, not against a world in which payment has no cost.
Operational details are central to this value proposition. A mobile-first design can lower entry friction, while accessible authentication can improve inclusion. Poor refund handling, outages or wrongful account restrictions can destroy the benefit of rapid execution. For a credit-linked product such as buy now, pay later, convenience and conversion must be assessed together with underwriting, expected losses, consumer indebtedness and funding costs. A payment feature and a credit feature are complementary services, not the same product.
The useful metrics therefore include active users, transaction frequency, merchant acceptance, conversion, fraud-adjusted contribution, retention and acquisition cost. Download counts and registered accounts provide incomplete information. A controlled rollout or credible comparison group is more informative about incremental sales than observing that highly engaged customers spend more: customers may join a loyalty programme precisely because they already buy frequently.
Payment mixes in 2024: value, volume and channel
Offline and online retail have different transaction needs. Physical cash can be useful at a point of sale but cannot be handed directly to a remote merchant. Online wallets, invoices and account transfers can therefore occupy a larger role in e-commerce, while card form factors differ between physical and digital checkout. Moving a sale online can change which provider controls the customer relationship even if bank money still funds the final transaction.
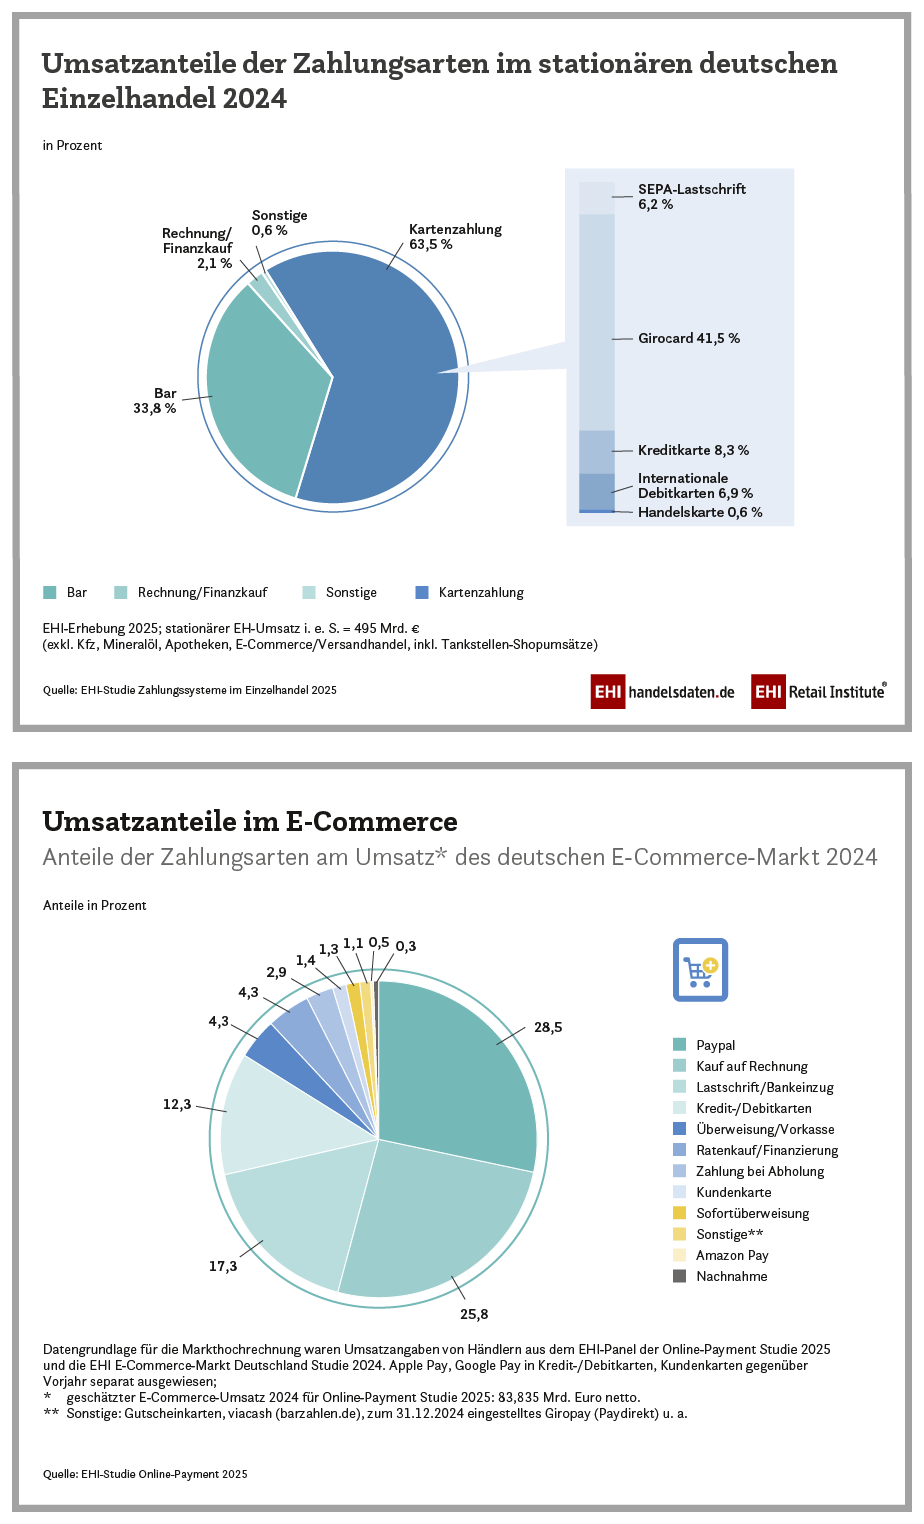
The two 2024 snapshots compare payment methods within each channel; they are not a time series. The physical-retail chart separates cash, card-based payments, invoice or financing purchases and other methods, and then breaks down the card-based category. The e-commerce chart distinguishes PayPal, invoice payment, direct debit, credit and debit cards, advance transfers, instalment financing, payment on collection, customer cards, immediate-transfer services, other methods, Amazon Pay and cash on delivery. Shares use the respective channel’s transaction value; the populations and reporting basis are not identical.
| Channel | Method | Share | Interpretation |
|---|---|---|---|
| Physical retail | Cash | 33.8% | Value share differs from the 54.6% share of transaction count. |
| Physical retail | Girocard | 41.5% | Domestic card category. |
| Physical retail | International debit cards | 6.9% | Separate from Girocard in this classification. |
| Physical retail | Credit cards | 8.3% | Separate from debit cards. |
| Physical retail | SEPA direct debit | 6.2% | The published classification distinguishes it from the other card categories. |
| Physical retail | Other methods | 3.3% | Residual after the displayed rounded shares. |
| E-commerce | PayPal | 28.5% | Value share in the online comparison. |
| E-commerce | Invoice payment | 25.8% | Payment after invoicing. |
| E-commerce | Direct debit | 17.3% | Account-based collection. |
| E-commerce | Credit and international debit cards | 12.3% | The online grouping differs from the offline grouping. |
| E-commerce | Other methods | 16.1% | Includes the remaining online methods. |
The cash result illustrates the importance of denominators: cash can account for most purchases by number while representing a smaller share of their combined value because cash transactions tend to be smaller. The table also corrects a common classification mistake: the online card category includes international debit cards, so it should not be labelled simply “credit cards”. These are historical survey results for 2024, not current shares or a complete census of every payment. In the full graphics, the physical-retail value basis is EUR 495 billion, while the e-commerce estimate is EUR 83.835 billion net of tax. Their percentages can be compared within their respective definitions, but their euro totals should not be added without harmonising scope and tax treatment.
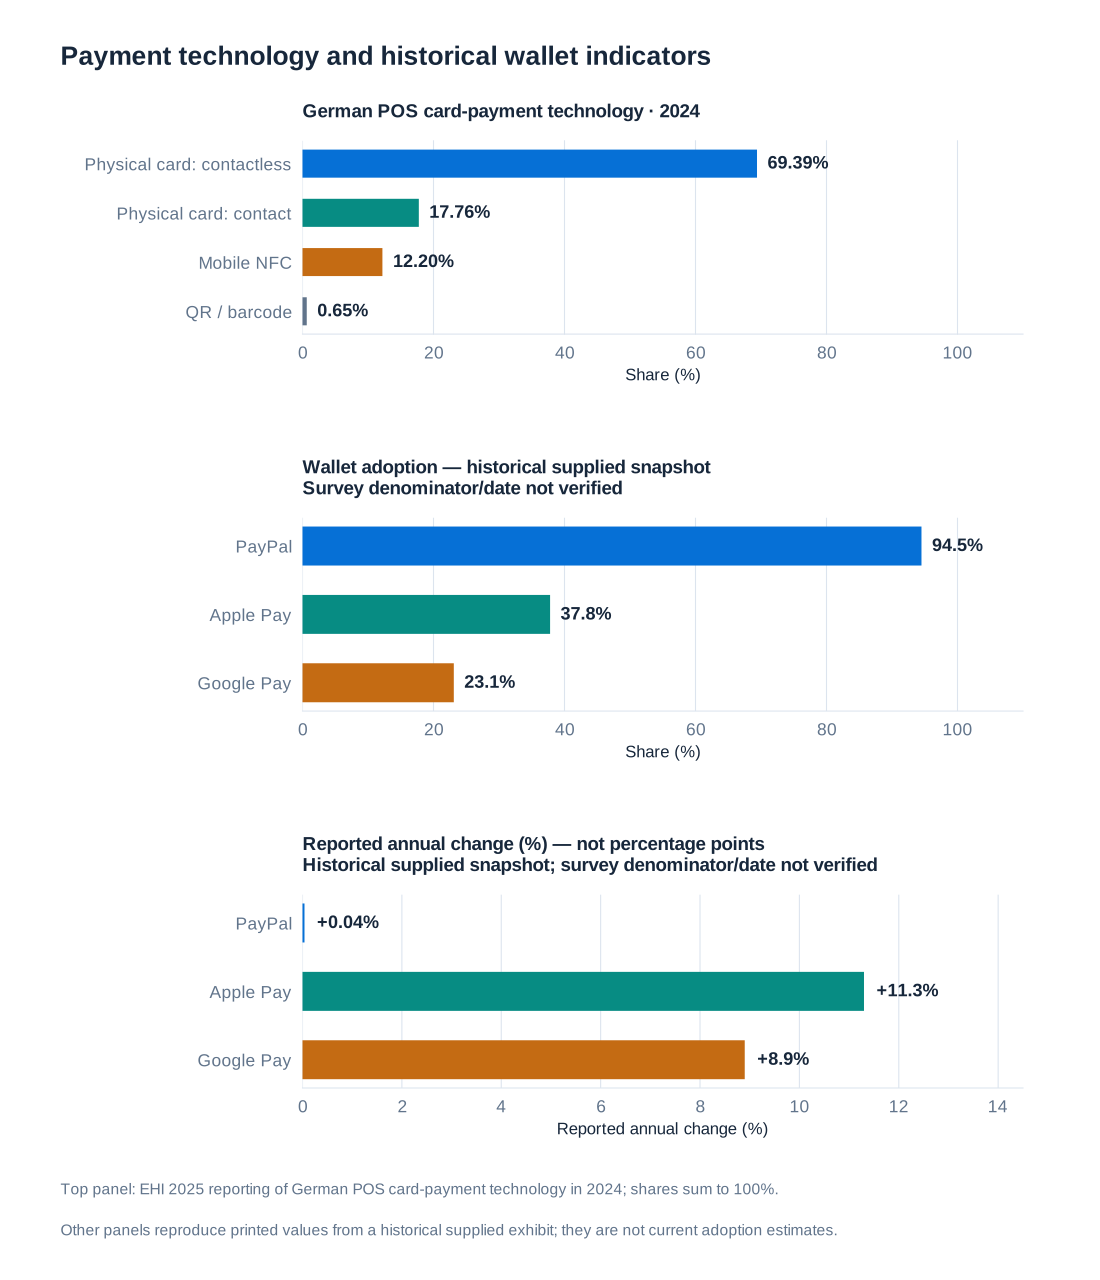
Form-factor penetration provides another perspective. Contactless physical cards, chip-based cards and mobile wallets describe how customers initiate payments. Merchant availability of a wallet, consumer adoption of a wallet and its share of actual purchases are different quantities. Multiple-wallet adoption rates can sum to more than 100%, while mutually exclusive transaction shares should sum to approximately 100% after rounding. Historical wallet charts must therefore retain their survey population and definition; where these are not specified, they illustrate categories rather than support a precise population-wide estimate.
Historical retail data: EHI Retail Institute, Zahlungssysteme im Einzelhandel 2025 and Online-Payment 2025, both reporting 2024 activity. The final category in each group is the residual of the displayed rounded shares.
Revenue, payment volume and profit are different quantities
Payment value is the amount transferred for customers, not the provider's revenue. If a provider handles EUR 1 billion and earns EUR 10 million, its revenue take rate is 1%. If it earns EUR 2 million of profit, profit is 0.2% of payment value but 20% of revenue. The denominators answer different questions. Confusing them can produce comparisons that exaggerate or conceal differences in business models.
Illustrative historical comparison figures of 0.2% or 0.3% for a card-related charge, 1.74% for wallet revenue and 2.7% for a credit-linked service are not interchangeable measures. Interchange is only one component of a merchant's total payment cost, while a wallet or credit product can combine processing, buyer protection, financing and other services. Likewise, illustrative profit-to-payment-value ratios of 0.05%, 0.52% and 1.5% do not establish directly comparable corporate profit margins. Without matched dates, geography, product scope and accounting definitions, such figures should be used to explain measurement, not rank named providers.
For example, if a provider has revenue equal to 1.74% of payment value and profit equal to 0.52% of the same payment value, the implied profit margin on revenue is
This is valid arithmetic under the stated assumptions, not a verified current margin of a particular company. Consolidated profit can also contain activities unrelated to payment processing, while transaction margins may exclude acquisition and fixed infrastructure costs.
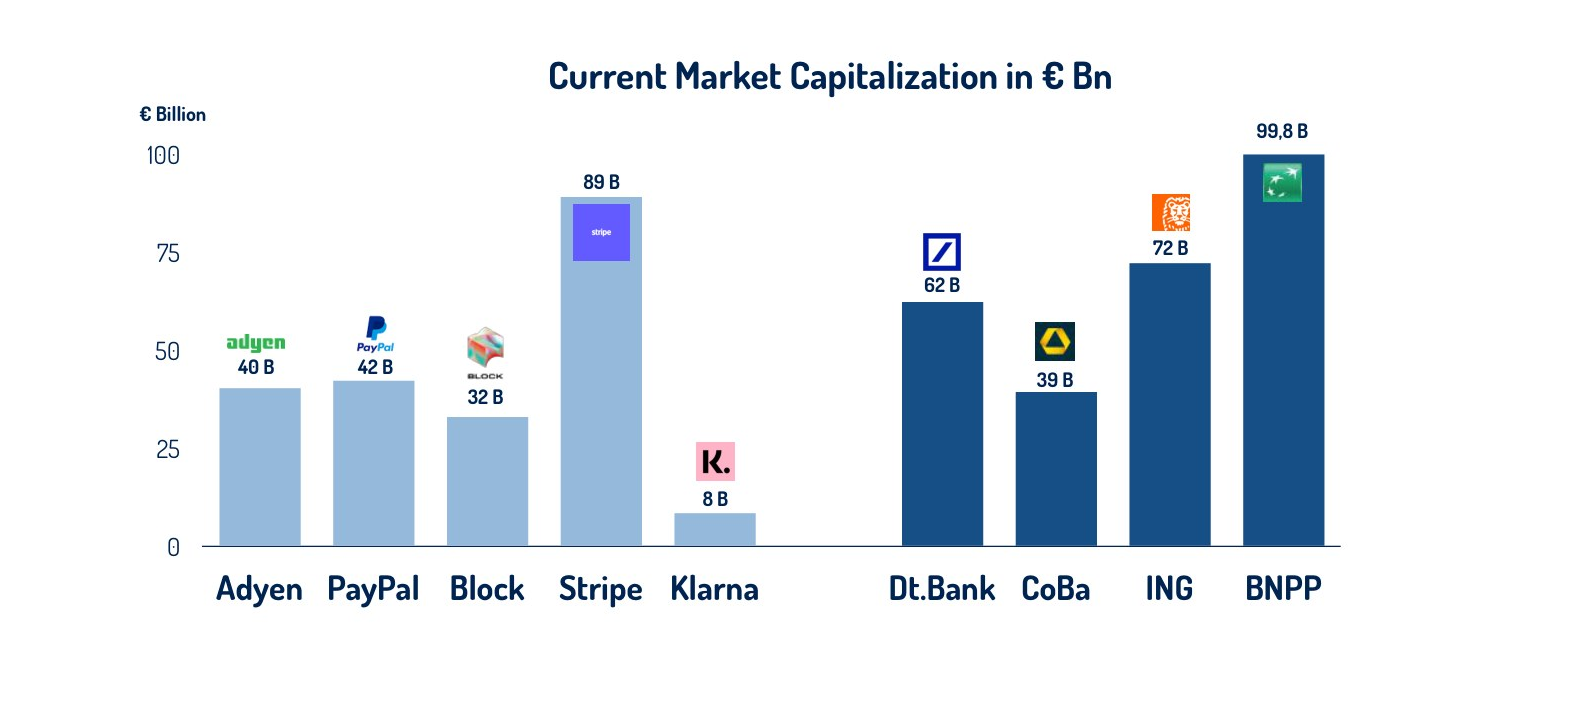
The historical valuation comparison shows that payments can support large standalone businesses, but equity valuation is a stock reflecting expected future cash flows and risk. It is not payment throughput, a bank's asset size or regulatory capital. Private funding-round valuations may be infrequent and attach to securities with different rights; they are not necessarily comparable with the continuously traded market capitalisation of common shares. A valuation chart therefore raises questions about business models rather than proving that one business is economically superior.
Worked example: contribution, fixed costs and break-even volume
Suppose a provider processes 50 million transactions annually, earning average revenue of EUR 0.18 and incurring variable cost of EUR 0.11 per transaction. The contribution per transaction is EUR 0.07. Total revenue is EUR 9 million, variable cost is EUR 5.5 million, and contribution before fixed expenses is EUR 3.5 million. This is the integrated payment-pricing example; calling the EUR 3.5 million “net profit” would omit necessary costs.
Let be the number of transactions, revenue per transaction, variable cost per transaction and annual fixed expenses. Then
With , annual operating profit is EUR −0.5 million. If the per-transaction assumptions remain unchanged, break-even volume is
Processing another 10 million transactions adds EUR 0.7 million of contribution, turning profit into EUR 0.2 million if it requires no additional fixed capacity.
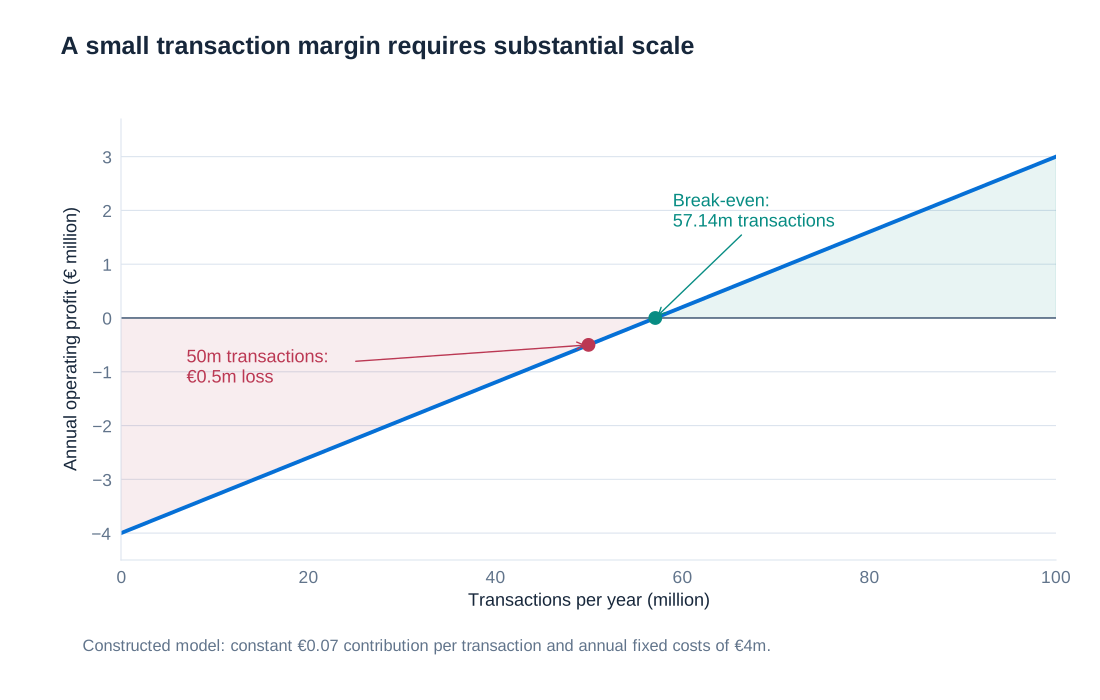
The constant-cost assumption is only a starting point. Fraud losses may rise, higher-risk merchants may join, compliance costs may increase, or price discounts may be needed to attract volume. If the variable cost rises to EUR 0.14, the margin becomes EUR 0.04 and break-even volume increases to 100 million transactions. If , more volume cannot cover positive fixed costs under the unchanged model. Growth creates value only when its incremental benefits exceed its incremental costs.
Loyalty payments: the Starbucks case
A merchant wallet can combine payment, loyalty rewards and ordering. Prepayment supplies funds before goods are delivered; mobile ordering can reduce checkout friction; rewards may encourage repeat use. These mechanisms are economically distinct. A customer's unspent balance is initially an obligation to provide future goods or services, not immediate sales revenue. Nor does receiving prepaid customer balances by itself turn a retailer into a deposit-taking bank.
Starbucks' fiscal 2024 reporting records loaded card amounts as deferred revenue until redemption and recognises estimated unredeemed balances, or breakage, according to its accounting policy and applicable unclaimed-property requirements. Its combined stored-value and loyalty liability reconciles as follows.
| Item | Amount | Interpretation |
|---|---|---|
| Opening balance, 1 October 2023 | 1,567.5 | Existing deferred obligations |
| Activations, reloads and Stars earned | +15,807.1 | Newly deferred revenue |
| Card and Stars redemptions and breakage | −15,665.1 | Revenue recognised and obligations reduced |
| Other movements | +9.2 | Primarily currency translation |
| Closing balance, 29 September 2024 | 1,718.7 | Remaining combined obligation |
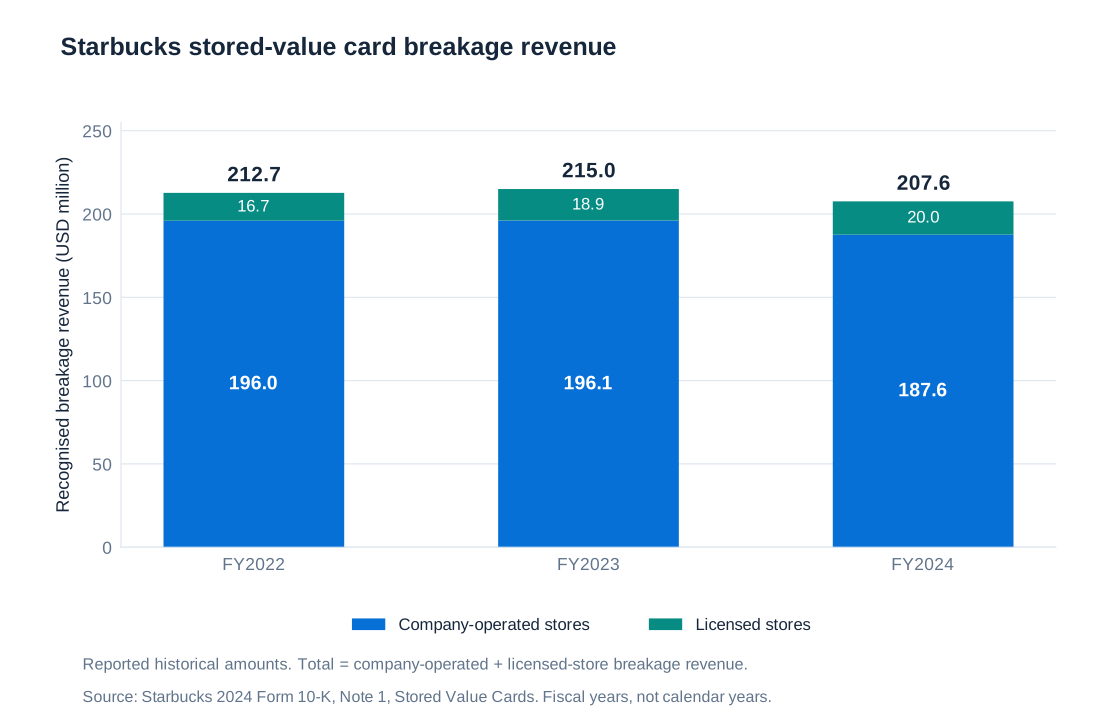
The breakage series totals USD 212.7 million in fiscal 2022, USD 215.0 million in 2023 and USD 207.6 million in 2024. It does not rise in every year. These totals combine company-operated and licensed-store revenue and are distinct from interest earned on invested cash. The combined liability table also includes loyalty Stars, so it should not be described as a pure balance of unused gift-card cash.
A retailer may benefit economically from the interval between receiving cash and supplying goods: holding cash can generate investment income or reduce financing needs. That benefit depends on rates, cash management and costs; it should not be inferred from an unverified estimate of “interest attributable to the wallet”. Breakage is also not proof of an equivalent increase in net profit, because programme administration, rewards, marketing and other costs remain.
Charts showing that loyalty members spend more than non-members are descriptive. They do not alone show how much extra spending the programme caused: customers who already visit frequently are more likely to join. The same caution applies to estimates of additional revenue, active-user growth and mobile-order penetration. Their economic relevance is clear, but causal claims require a credible counterfactual and consistent definitions.
Primary financial evidence: Starbucks, fiscal 2024 Form 10-K, stored-value-card accounting and Note 11. The chart uses the reported historical breakage amounts, not a forecast.
Critical mass, interoperability and the difficulty of coordination
New systems can recruit a large bank coalition and still struggle with adoption. Participants may disagree about pricing, branding, investment, technology or the distribution of customer relationships. Merchants need a reason to integrate the method and customers need a reason to choose it. Broad institutional support is therefore helpful but insufficient.
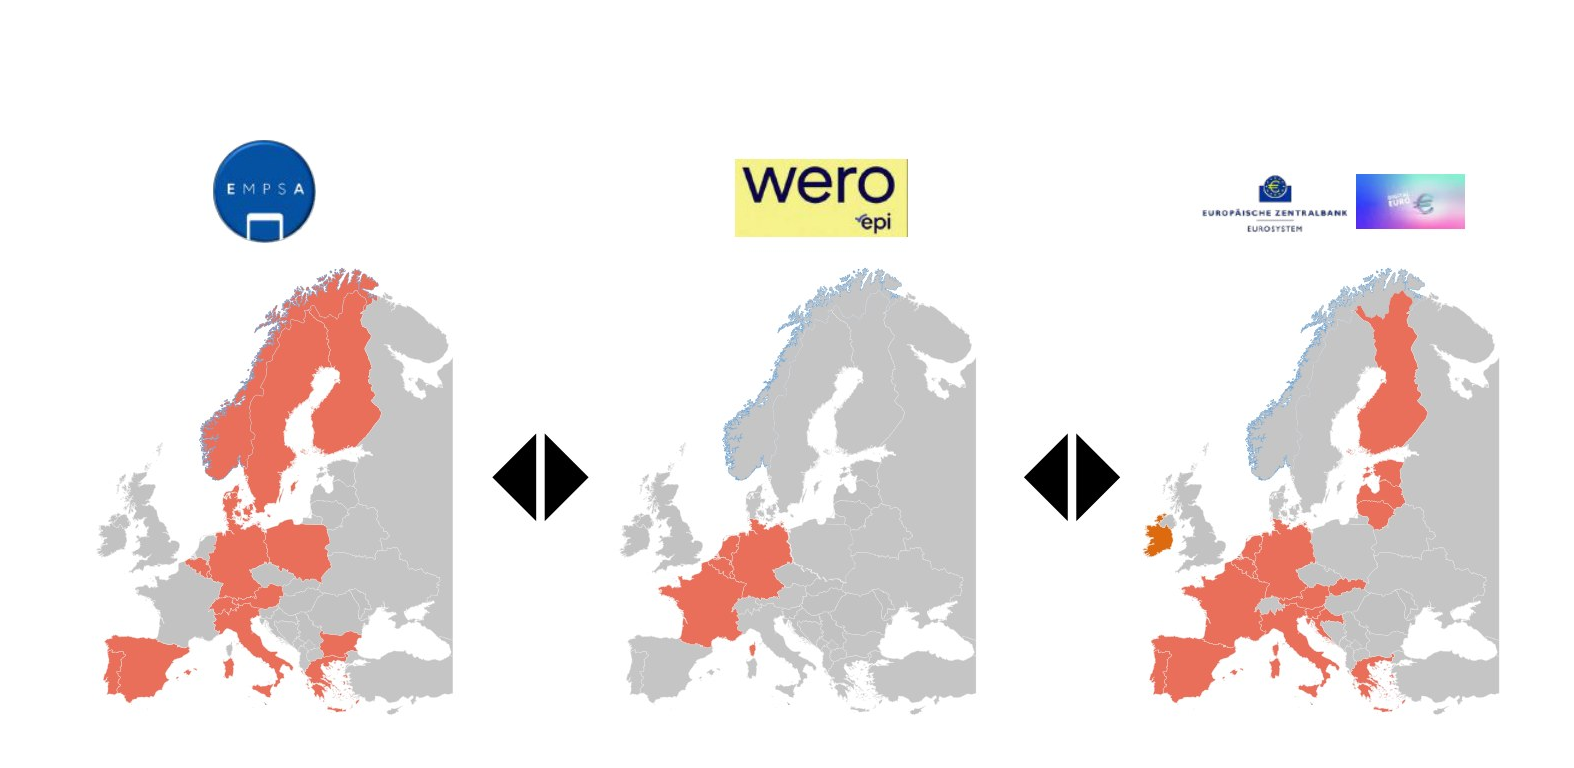
A geographic map can show participating countries or institutions without showing universal merchant acceptance. National person-to-person success does not automatically translate into cross-border e-commerce acceptance. The historical comparison of European initiatives illustrates how interoperability might extend reach, but actual usefulness depends on compatible rules, interfaces, merchant integration and commercial incentives. A payment system can be technically reachable while remaining unfamiliar to users.
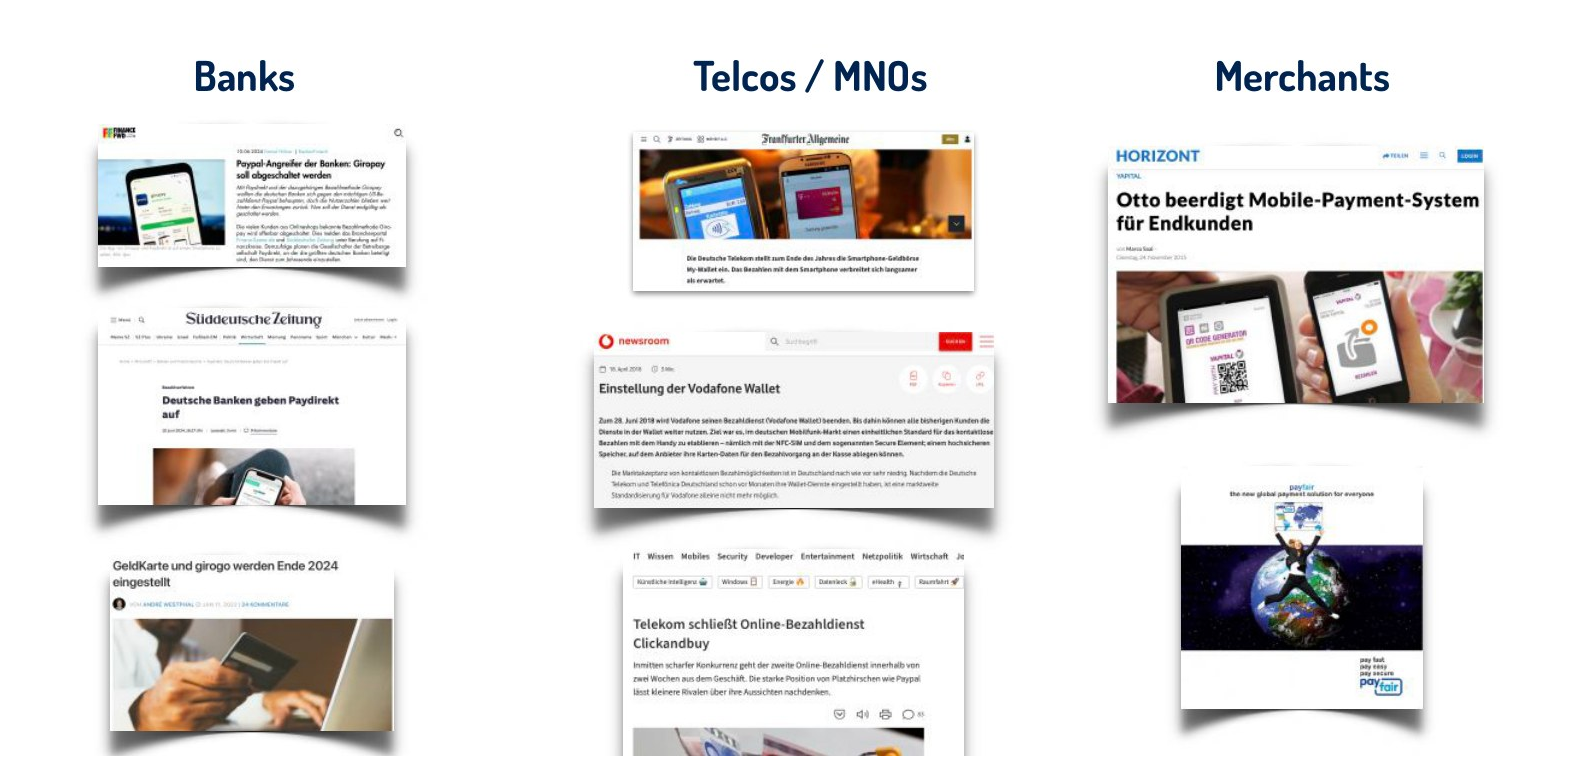
Historical exits by bank, telecom and merchant payment projects demonstrate that access to customers or infrastructure does not guarantee a sustainable product. Examples include bank-led initiatives such as Paydirekt, telecom wallets and merchant-specific systems. Their causes should not be collapsed into one universal explanation: timing, governance, pricing, incumbent responses and customer experience differ. A discontinued project can also contribute technology or experience to a later service rather than representing a complete loss of learning.
Competition policy and payment regulation can influence these dynamics. Access to essential interfaces, portability, interoperability and rules against exclusion may lower entry barriers, but can also require careful governance and security standards. A subsidy that solves an initial coordination problem may be commercially rational, while perpetual subsidies with no credible positive contribution are not evidence of a viable network. The relevant welfare assessment includes consumer surplus, merchant costs, innovation, inclusion and resilience, rather than provider profit alone.
Public digital money and the rationale for a digital euro
The Libra proposal announced in 2019 showed why a global privately governed payment instrument could raise questions about monetary sovereignty, competition, governance and financial stability before achieving widespread use. Public authorities also investigate digital forms of central-bank money. A retail central-bank digital currency would give the public a digital claim on the central bank, distinct from a commercial-bank deposit or private stablecoin.
The proposed digital euro can be assessed against several objectives: continued access to public money as commerce becomes more digital, pan-European acceptance, resilience, privacy and reduced dependence on particular private infrastructures. These are policy objectives, not benefits established solely by announcing a project. Costs include building and maintaining infrastructure, customer support, fraud prevention, changes for merchants and intermediaries, and potential effects on bank funding.
Status checked on 14 October 2026: the ECB describes a twelve-month pilot expected to begin in the second half of 2027 and readiness for a potential first issuance during 2029, conditional on the necessary legislative framework and decisions. A planned pilot is not a launched retail currency, and its expected timetable is not a guarantee. The analysis below describes design proposals and mechanisms rather than claiming that the public can already use a digital euro.
Project status: ECB, Digital euro pilot.
Access, privacy, holding limits and conditional payments
A public digital payment instrument requires an operational distribution model. Intermediaries can provide onboarding, wallets and customer services even though the monetary claim is against the central bank. Online and offline modes have different information flows, fraud controls and recovery needs. Offline functionality can support resilience and privacy when connectivity fails, but secure devices, lost-value risks and synchronisation still require design choices.
| Dimension | Design objective or proposed mechanism | Economic trade-off |
|---|---|---|
| Monetary claim | Public central-bank money | Issuer safety does not remove cyber or service-provider risk. |
| Access | Intermediated services through applications, cards or other accessible interfaces | Usability must accommodate people with different devices and abilities. |
| Offline use | Payments without continuous internet access | Resilience and privacy must be balanced with device and fraud controls. |
| Privacy | Data minimisation with distinct online and offline arrangements | Pseudonymity, anonymity and lawful data access are different properties. |
| Holding limits | Limit use as a large-scale investment or flight-to-safety balance | Funding stability must be reconciled with convenient payments. |
| Remuneration | The proposed retail design is non-interest-bearing | Reduces incentives to replace savings deposits. |
| Linked-account funding | Automatic funding of payment shortfalls and transfer of excess receipts | Convenience depends on sufficient bank funds and reliable connections. |
| Conditional payments | Optional services such as payment on delivery | Useful automation still requires reliable information and dispute resolution. |
| Acceptance | Retail, online, person-to-person and relevant public-sector use cases | Common standards do not eliminate merchant integration costs. |
The ECB's proposed design distinguishes non-programmable money from optional conditional payment services and includes holding limits, no remuneration and linked-account funding mechanisms. No particular numerical holding limit should be treated as settled merely because a value has been examined in a technical exercise. Basic individual use is intended to be free, while providers can have costs and offer additional services. These design statements do not mean every participant or every value-added service would be free of charge.
Design description: ECB, FAQs on the digital euro, as checked on 14 October 2026.
Comparing a bank transfer with a digital-euro payment
In a conventional account-to-account transfer, the payer's bank deposit falls, the payee's bank deposit rises and any interbank obligation is settled through the relevant infrastructure, potentially in central-bank money. The customers continue to hold commercial-bank claims. In a digital-euro transfer, the customer's monetary balance would be a central-bank claim. Funding and defunding connect that balance with a linked bank account where used; the customer-facing intermediary remains distinct from the issuer of the money.
For a conceptual example, a person with EUR 30 of digital-euro balance wants to make an EUR 80 payment. If the design permits automatic linked-account funding and the account has sufficient available funds, EUR 50 can be drawn to cover the shortfall. Conversely, receipts above a holder's permitted balance can be transferred back to a linked bank account under a waterfall arrangement. This example illustrates the mechanism; it does not assume a particular final holding limit, fee or technical routing.
| Question | Instant bank-account transfer | Proposed digital-euro transfer |
|---|---|---|
| What does the customer hold? | A deposit claim on a commercial bank | A central-bank monetary claim accessed through the distribution arrangement |
| What changes between customers? | Bank deposit balances | Digital-euro balances, with funding or defunding where applicable |
| Where does settlement safety come from? | Bank payment arrangements and their settlement infrastructure | Public monetary claim and the digital-euro system's rules and controls |
| Is an internet connection always necessary? | Depends on the service and initiation channel | The proposed design includes a distinct offline mode |
| What remains necessary? | Authentication, compliance, fraud prevention and customer service | Authentication, appropriate compliance, fraud prevention and customer service |
| What is the main comparison? | Existing speed, reach, protections and total cost | Additional public-money access, reach and resilience relative to implementation and funding effects |
Adding funding and defunding steps can create operational dependencies, but a diagram with more arrows is not enough to prove that the service is inefficient. Some steps may be automated and the objective may include access to a different monetary claim or an offline mode. Equally, public issuance does not by itself establish that a new service improves every online transaction. The correct assessment identifies the particular use case, the benefits delivered and the complete resource and risk costs.
The same framework applies across payment innovation: identify the money, the service layers, the participants, the incentives and the counterfactual. Speed without acceptance has limited value; broad acceptance without reliable protection can harm users; profitability without competitive pressure can coexist with excessive merchant costs. A durable payment arrangement aligns these requirements sufficiently to attract repeated use and withstand operational and financial stress.