
2. Bank Balance Sheets, Profitability and Performance
A bank's financial statements describe both the service it provides and the risks it accepts. A traditional lender holds loans and liquid assets against deposits and other funding. A broker may administer large customer portfolios while keeping little market exposure for its own account. A universal bank combines lending with wealth management, securities trading and other activities. The balance sheet shows the resulting stocks at a particular date; the income statement explains the flows of revenue, cost and profit over a period. Reading either statement in isolation can give a misleading impression of the institution.
This chapter develops a consistent method for interpreting these statements, then applies it to historical examples from Frankfurter Sparkasse, Trade Republic and UBS. The dates and accounting conventions are part of each example. Figures from different years or reporting frameworks are useful for comparing business models, but they are not a ranking of the institutions' current strength. The worked stress tests and strategy changes are constructed scenarios, not forecasts or statements about events that actually occurred.
Assets, liabilities and equity
Assets are economic resources or claims held by the bank. Cash and central-bank reserves support payments; securities can provide investment income and, depending on their characteristics, liquidity; loans generate contractual interest and principal payments from borrowers. Other assets may include property, equipment, receivables and intangible assets. Liabilities are obligations to outsiders, including customer deposits, interbank borrowing, issued debt and other payables. A customer deposit is an asset of the customer but a liability of the bank. Equity is the residual interest after recognised liabilities are deducted from recognised assets.
Let denote assets, liabilities and equity, all measured in the same currency at the same date. The accounting identity is
The identity must hold after every transaction. If a bank grants a EUR 10,000 loan and credits the customer's account, loan assets and deposit liabilities both rise by EUR 10,000. If the customer then pays someone at another bank, the originating institution loses the customer deposit and must deliver settlement resources to the receiving institution. The original loan remains on its balance sheet. Deposit creation and subsequent funding needs are compatible; the ability to create an accounting entry does not remove constraints on capital, credit quality or settlement liquidity.
Equity is not a pile of cash in a separate account. It is a funding claim and an accounting residual. A bank can invest resources financed by equity in illiquid loans, just as it can hold cash financed by deposits. This explains why a well-capitalised institution can face a liquidity shortage and why a cash-rich institution can still have insufficient asset value to cover its debts. The amounts at which assets appear in the accounts also depend on the relevant recognition and measurement rules. Book values, market values and regulatory exposure values need not coincide.
Leverage magnifies asset losses and shareholder returns
The accounting equity ratio is , while assets-to-equity leverage is . Consider assets of EUR 1,000 million, liabilities of EUR 950 million and equity of EUR 50 million. The equity ratio is 5% and leverage is 20 times. An impairment of EUR 20 million reduces assets to EUR 980 million. If liabilities remain EUR 950 million, equity falls to EUR 30 million: a 2% loss of assets has destroyed 40% of the initial equity. The change is not an additional cash payment by shareholders; it is the effect of the residual claim absorbing the asset loss.
If leverage had instead been 50 times, initial equity would have been only 2% of assets, and the same 2% asset loss would exhaust it. The calculation deliberately excludes taxes, new capital, profit earned during the period and any change in liabilities. It illustrates sensitivity rather than determining a regulatory capital requirement. A bank's capital adequacy also depends on the risks of its assets, off-balance-sheet commitments and the eligibility of its capital instruments.
Leverage also explains why return on equity can look high when return on assets is modest. With net income of EUR 10 million on EUR 1,000 million of assets and EUR 50 million of equity, return on assets is 1% and return on equity is 20%. Using the same profit numerator and consistent balance definitions,
Average balances are generally preferable when comparing a flow earned over the year with the resources used to earn it; year-end balances can be used for a simplified exercise if clearly identified. The identity is a decomposition, not proof that raising leverage creates economic value. Debt-funded expansion can increase funding costs and risk, while a reduction in equity makes the remaining shareholders more exposed to a given loss.
A deposit-and-loan bank: the Frankfurter Sparkasse example
Frankfurter Sparkasse illustrates a regional savings-bank model: it takes deposits, makes loans and holds assets that support payments and liquidity management. The simplified statement below groups its 2024 accounts into broad economic categories. The analytical equity amount includes the fund for general banking risks, so it is broader than a narrowly defined ordinary equity line in statutory accounts. It should not be identified automatically with common equity tier 1, or CET1, capital. The latter requires prudential eligibility tests and adjustments.
| Assets | Amount | Liabilities and equity | Amount |
|---|---|---|---|
| Cash | 269 | Deposits | 21,171 |
| Securities | 4,959 | Other liabilities | 315 |
| Loans | 17,124 | Analytical equity, including general banking-risk fund | 1,238 |
| Other assets | 372 | — | — |
| Total assets | 22,724 | Total liabilities plus analytical equity | 22,724 |
Loans account for EUR 17,124 million of assets, but not all of them are household or corporate customer loans: EUR 6,203 million are claims on banks and EUR 10,921 million are customer loans. EUR 4,958 million of the customer-loan book is backed by real-estate collateral. Collateral can reduce loss severity but does not make a loan risk-free; its value and realisability matter when the borrower defaults. EUR 14,081 million of total loans have more than one year remaining to maturity, whereas EUR 16,050 million of deposits are overnight funding.
| Category | Component | Amount |
|---|---|---|
| Securities | Fixed-income instruments | 4,258 |
| Securities | Equity instruments | 701 |
| Securities | Total | 4,959 |
| Loans | Loans to banks | 6,203 |
| Loans | Loans to customers | 10,921 |
| Customer loans | Of which: real-estate collateral | 4,958 |
| Loans | Total | 17,124 |
| Total loans | Of which: remaining maturity over one year | 14,081 |
| Deposits | Overnight | 16,050 |
| Deposits | Other deposits, rounded | 5,122 |
| Deposits | Reported total | 21,171 |
The separately rounded overnight and other-deposit amounts add to EUR 21,172 million, whereas the reported deposit total is EUR 21,171 million. The reported total is used consistently in the ratios and scenarios.
The distinction between fixed-income securities and equities matters for stress analysis. The securities total is EUR 4,959 million, comprising EUR 4,258 million of fixed-income instruments and EUR 701 million of equities. A sovereign-default scenario applied to all fixed-income securities therefore uses EUR 4,258 million, not the entire securities portfolio. Similarly, a simple liquidity calculation that counts every security at its current carrying amount makes a strong assumption about saleability and prices; equities and long-duration bonds are not interchangeable with cash.
Historical accounting basis: Frankfurter Sparkasse, annual report 2024, regrouped and rounded for analysis. The fund for general banking risks is governed by section 340g of the German Commercial Code. Section 340e contains particular valuation and trading-book provisions; it is not the general statutory heading for this fund.
Funding and liquidity ratios need explicit denominators
The equity ratio expresses the size of the loss-absorbing accounting cushion. The loan-to-deposit ratio compares one main use of funds with one main source. The liquid-assets ratio measures the share of assets allocated to a specified liquid category. None is a complete risk assessment. Loans can be risky even when they are fully funded by deposits; a bank with a loan-to-deposit ratio below 100% can still experience a run; and securities classified as liquid in a simple accounting exercise may be encumbered or saleable only at a discount.
| Indicator | Calculation | Result | Interpretation |
|---|---|---|---|
| Analytical equity ratio | 1,238 / 22,724 | 5.45% | Accounting loss-absorption buffer relative to assets |
| Loan-to-deposit ratio | 17,124 / 21,171 | 80.88% | Loan volume relative to deposit funding |
| Simple liquid-assets ratio | (269 + 4,959) / 22,724 | 23.01% | Cash plus all securities relative to assets |
| Overnight funding / total funding | 16,050 / 22,724 | 70.63% | Funding denominator includes analytical equity |
| Overnight funding / liabilities | 16,050 / (22,724 − 1,238) | 74.70% | Funding denominator excludes analytical equity |
The overnight-funding ratio particularly requires care. Dividing EUR 16,050 million by total assets of EUR 22,724 million gives 70.63% of total funding including analytical equity. Dividing by liabilities excluding that equity, EUR 21,486 million, gives 74.70%. Both calculations can be informative, but they answer different questions. Labelling the first denominator “total liabilities” while including equity obscures the distinction. Nor does a non-overnight funding share guarantee that all remaining funding is unconditionally available under every stress: contractual options, collateral calls and other obligations may still matter.
A book equity ratio differs from a regulatory CET1 ratio, whose denominator is risk-weighted exposures rather than unweighted assets. A simple liquid-assets ratio also differs from the liquidity coverage ratio, which applies eligibility rules, haircuts and a defined 30-day stress to cash inflows and outflows. These regulatory measures are developed later. Here the purpose is to extract economically meaningful information from a simplified balance sheet while stating the limits of each measure.
From interest revenue to net profit
Interest income is the gross revenue earned from interest-bearing assets. Interest expense is the cost of interest-bearing funding. Their difference is net interest income, or NII. Fees and commissions reward services such as account administration, payments, investment distribution and advice. Trading results arise from market-making or other positions and can be volatile. Administrative expenses pay for staff, premises, technology and other operating resources. Credit-loss charges recognise deterioration in the expected collection of assets. Taxes and other separately reported items then determine the final profit.
| Item | Amount | Interpretation |
|---|---|---|
| Interest income (component) | 699.7 | Interest earned on loans, securities and other relevant assets |
| Interest expense (component) | −377.1 | Interest paid on deposit funding in the simplified presentation |
| Net interest income (reported subtotal) | 322.5 | Use this subtotal once in the profit bridge |
| Net fee and commission income | 121.0 | Account, transaction and related service revenue |
| Trading income | 0.0 | No material amount in this grouping |
| Credit-loss provisioning expense | −23.8 | Precautionary expense for increased risk of future loan losses |
| Salary and administrative expense | −295.9 | Personnel, premises, technology and other operating costs |
| Allocation to the general banking-risk fund | −40.0 | Separate HGB allocation, not a realised borrower default |
| Other income and costs, net | 33.8 | Remaining grouped items |
| Income before tax | 117.6 | Reported pretax result |
| Tax expense | −57.6 | Deduction from pretax result |
| Income after tax | 60.0 | Reported net result |
The EUR 23.8 million credit-loss charge is a precautionary expense accounting for increased risk of future loan losses. It is not a profit generated because a borrower previously expected to default suddenly repaid. A provision expense lowers profit; a release of an existing allowance normally has the opposite effect. The precise recognition and measurement rules depend on the applicable accounting framework. Under IFRS 9, expected-credit-loss accounting is forward-looking; the statutory German accounts in this historical example must nevertheless be understood under their own HGB framework, rather than silently replacing it with IFRS terminology.
The EUR 40 million allocation to the fund for general banking risks is separate from the credit-loss charge. It reduces the reported income available after that allocation but contributes to the broader analytical capital buffer used here. Treating it as an additional realised borrower default would therefore be misleading. Using the reported net interest income and the grouped items, the profit bridge is million before tax, and million after tax. The gross rounded interest amounts differ from the reported net interest subtotal by EUR 0.1 million; the reported subtotal is retained rather than forcing an artificial reconciliation.
For comparison, an entirely illustrative bank earning EUR 54 million of interest and paying EUR 26 million generates NII of EUR 28 million. Adding EUR 12 million of fees and deducting EUR 24 million of operating costs and EUR 8 million of credit-loss charges produces EUR 8 million before tax. If average interest-earning assets are EUR 1,400 million, its net interest margin is . This example separates the absolute amount of income from the rate earned on the underlying asset base.
Asset yields, funding costs and operating efficiency
The simplified average yield on cash, securities and loans in the Sparkasse example is . This denominator uses year-end amounts and includes cash, so the result is an analytical approximation rather than a contractual loan interest rate. The average interest expense on deposits is . Its denominator is deposits only, not deposits plus other liabilities. The difference is percentage points.
| Measure | Calculation | Result |
|---|---|---|
| Average asset yield, simplified | 699.7 / (269 + 4,959 + 17,124) | 3.13% |
| Average interest expense on deposits | 377.1 / 21,171 | 1.78% |
| Asset-yield minus deposit-cost spread | 3.13% − 1.78% | 1.35 percentage points |
| Cost-to-income ratio under the stated grouping | 295.9 / (322.5 + 121.0 + 0.0) | 66.72% |
| After-tax return on analytical equity | 60.0 / 1,238 | 4.85% |
This yield–cost spread is not identical to net interest margin. NIM divides net interest income by a defined asset base, commonly average interest-earning assets. Subtracting two rates calculated on different denominators is economically useful but is not an algebraic replacement for dividing net income by assets. Deposit service fees, non-interest-bearing balances, wholesale funding and the asset mix further complicate comparisons. A higher loan rate may compensate for expected defaults, illiquidity, origination expense or capital consumption instead of representing a pure increase in profit.
The cost-to-income ratio used here is , or about 66.7%. Operating expense therefore absorbs roughly two thirds of the specified revenue before the separately reported credit-loss charge and other items. Different institutions may include other operating income, treat restructuring costs differently or use another denominator. A lower ratio can indicate greater efficiency, but it can also result from temporarily buoyant trading income or insufficient investment in systems. A ratio only becomes comparable after its components are reconciled.
The after-tax return on analytical equity is . This does not imply that every shareholder or owner received a 4.85% cash distribution; accounting profit may be retained. Nor does it measure a market return, which also depends on the price paid for the equity and changes in that price. Profitability, payout and valuation are related but distinct concepts.
A brokerage model: Trade Republic in September 2023
The historical Trade Republic example captures a predominantly brokerage and transaction-service business before its full banking licence was announced in December 2023. At the September 2023 reporting date, customer cash in the simplified presentation was held through trust arrangements with partner banks. Calling these balances “deposits” for a business-model comparison must not imply that their legal treatment was identical to ordinary deposits funded directly on a traditional lender's balance sheet. The date is essential: this is not a description of all products or legal arrangements offered subsequently.
| Assets | Amount | Liabilities and equity | Amount |
|---|---|---|---|
| Cash | 10 | Customer cash shown as deposits in the simplified comparison | 6,411 |
| Balances with banks, including customer trust arrangements | 6,966 | Other liabilities | 80 |
| Other assets | 47 | Equity | 532 |
| Total | 7,023 | Total | 7,023 |
The example reports approximately EUR 29 billion of assets under management and 3.5 million customers. Customer securities administered by a platform are not automatically assets owned by the platform. Consequently, the value of customer portfolios can greatly exceed the institution's own economic exposures. It is equally important not to conclude that the EUR 7,023 million presentation is entirely proprietary money: much of it reflects matched customer trust balances. Separating customer property, custodial responsibilities and the firm's own assets is necessary before measuring leverage or credit risk.
| Item | Amount | Interpretation |
|---|---|---|
| Interest income (component) | 10.2 | Interest received from partner banks on deposits |
| Interest expense (component) | 0.0 | No material amount in this grouping |
| Net interest income (subtotal) | 10.2 | Do not add this subtotal to its own components |
| Fee and commission income | 148.7 | Brokerage and transaction-related services |
| Trading income | 0.2 | Small own-account result |
| Credit-loss provision charge | 0.0 | No material lending business in this example |
| Salary and administrative expense | −135.4 | Staff, premises, IT and marketing |
| Other income and costs, net | −7.4 | Other grouped items |
| Income before tax (reported) | 16.2 | Rounded reported subtotal |
| Tax expense | −2.2 | Rounded tax charge |
| Income after tax (reported) | 14.1 | Rounded reported result |
The EUR 10.2 million interest income represents interest received from partner banks on deposits, not negative interest on bank deposits. Fees and commissions of EUR 148.7 million dominate the revenue mix, while the reported credit-loss charge is zero in this simplified historical model without material lending activity. Operating costs, including technology, staff and marketing, remain substantial. Small differences of EUR 0.1 million arise when rounded components are recomputed; the reported subtotals are preserved.
Lower direct lending exposure does not mean negligible business risk. Falling asset prices can reduce customer portfolio values and any fees linked to them. Trading activity, investor confidence and customer retention can change revenue. Outages, failed orders, misuse of assets, cyber incidents, inaccurate statements or weak compliance can cause direct expense and reputational damage. Partner-bank exposure and the precise safeguarding arrangements also matter. A stress analysis appropriate for a mortgage lender cannot simply be copied onto a broker.
Historical licence chronology: Trade Republic announcement of 6 December 2023. The financial illustration uses the reporting year ending 30 September 2023 and should be interpreted at that date.
A universal bank: UBS at the end of 2024
A universal bank combines several intermediation technologies. UBS's simplified 2024 statement contains loans and deposits alongside large derivative, trading and repurchase-agreement positions. A reverse repo is economically a collateralised cash-lending arrangement; a repo is collateralised funding. The exact accounting depends on the contract and applicable rules, but the distinction explains why similar securities can participate in different financing transactions. A short position creates an obligation associated with selling a security the institution must subsequently deliver or repurchase.
| Assets | Amount | Liabilities and equity | Amount |
|---|---|---|---|
| Cash | 223.3 | Deposits | 745.8 |
| Loans | 598.9 | Other borrowed money | 214.2 |
| Derivative assets | 185.6 | Derivative liabilities | 180.6 |
| Trading assets | 159.1 | Short positions | 35.2 |
| Reverse repos | 118.3 | Repos | 14.8 |
| Other assets | 279.9 | Other liabilities | 288.7 |
| — | — | Equity | 85.6 |
| Reported total | 1,565.0 | Reported total | 1,565.0 |
The total of approximately USD 1.565 trillion indicates the scale of the group, but it is not itself a measure of expected losses. A derivative asset is generally the positive fair value of a contract, not its notional principal. Derivative liabilities may offset some market sensitivities, but gross accounting assets and liabilities cannot simply be netted without considering enforceable agreements, counterparties and collateral. Gross balance-sheet size, market risk, counterparty exposure and liquidity needs consequently provide different views of the same business.
| Item | Amount | Economic meaning |
|---|---|---|
| Interest income (component) | 43.1 | Interest on loans, deposits, repos, trading assets and other balances |
| Interest expense (component) | −35.9 | Cost of deposits, borrowing, repos, issued debt and other funding |
| Net interest income (reported subtotal) | 7.1 | Net interest contribution; use once in the earnings bridge |
| Credit-loss provisions | −0.6 | Expense for credit deterioration |
| Fee and commission income | 26.1 | Wealth-management and other service revenue |
| Trading income | 14.7 | Market-making and other trading results |
| Salary and administrative expense | −37.4 | Operating cost |
| Other income and expenses, net | −3.1 | Other grouped items |
| Income before tax | 6.8 | Pretax result |
| Tax expense | −1.7 | Deduction from pretax result |
| Income after tax | 5.1 | Net result |
Fees and commissions of USD 26.1 billion and trading income of USD 14.7 billion are central to this illustration, while net interest income is USD 7.1 billion. That combination differs substantially from a regional deposit-and-loan institution. The label “trading income” can include customer-driven market-making as well as proprietary risk; it should not be interpreted as pure speculation without examining the detailed accounts. Similarly, large administrative costs partly reflect the service-intensive nature of wealth management and the complexity of operating across markets.
Small rounding differences occur in the regrouped balance sheet and between rounded gross interest income and expense. They do not justify altering a published subtotal to make a teaching table add exactly. More fundamentally, a balance sheet and income statement alone cannot reveal the direction of every market sensitivity. Two banks with identical derivative asset values can react differently to an interest-rate shock because their contracts, maturities, hedges and collateral terms differ. Meaningful stress testing requires positions and cash flows at a much finer level of detail.
Interest-rate stress: earnings and market values are different channels
Consider a one-year earnings shock to the Sparkasse example. Assume market rates rise immediately by two percentage points, the increase is fully passed through to EUR 16,050 million of overnight deposits, other deposits and liabilities do not reprice, and all loans remain fixed rate for the year. Also assume cash and all securities earn the higher rate immediately, while no position changes market value. The last assumption is deliberately stylised: many fixed-rate bonds do not reprice their coupons, and an actual rate increase may reduce their market price.
Starting from pretax profit of EUR 117.6 million, the stressed result becomes a loss of EUR 98.84 million before tax. The incremental deterioration of EUR 216.44 million is 17.48% of initial analytical equity, while the stressed pretax loss itself is 7.98% of that equity. These are different quantities: describing the entire incremental shock as a fall in year-end capital while also subtracting the stressed loss would count the shock twice. Taxes, distributions and other changes in capital are excluded from this calculation.
The scenario illustrates a negative short-term repricing gap: rate-sensitive funding exceeds rate-sensitive assets. A lower deposit pass-through would reduce the earnings damage; variable-rate loans would increase the offsetting income response. In practice, deposit migration toward better-remunerated accounts can make funding costs rise even without a uniform increase on every account. Contractual repricing schedules, customer behaviour and hedges therefore determine the actual result.
A separate constructed example isolates the market-value channel. A fixed-income portfolio worth EUR 200 million has modified duration . For a parallel yield increase of 1.5 percentage points, the first-order estimate is
The minus sign reflects the inverse relationship between fixed-rate bond prices and yields. Modified duration is a local approximation, and 150 basis points is large enough that convexity can materially affect accuracy. The example excludes changes in credit spreads, optionality and cash flows. Whether and when such a value change affects reported profit or regulatory capital depends on the accounting classification and prudential treatment. An earnings stress and a market-value stress must therefore be specified separately before their results are combined.
Credit-loss and sovereign-risk stress
Suppose the bank must increase credit-loss provisions by 1% of its EUR 17,124 million loan book. The additional charge is million. Holding everything else constant, pretax profit becomes million. The incremental charge equals 13.83% of initial analytical equity. It is a charge against expected recoverability, not an assumption that EUR 171.24 million of cash necessarily leaves the bank that day. The provision can worsen solvency measures while having a different immediate liquidity effect.
Now assume, solely for a sovereign-risk scenario, that every EUR 4,258 million of fixed-income securities is a claim on one government, that default probability is 50%, recovery is zero and discounting is ignored. Expected repayment value falls to 50% of the initial exposure, implying a EUR 2,129 million loss under this simplified valuation. Initial equity of EUR 1,238 million is insufficient: subtracting that loss produces negative analytical equity of EUR 891 million. This is not an assertion that actual market prices always equal one minus a physical default probability; risk premia, timing, recovery and existing prices matter in a proper valuation.
The case shows how a concentrated government-bond portfolio can link bank and sovereign solvency. A weaker sovereign reduces the value of bank assets and possibly the credibility of public guarantees. Supporting banks can in turn increase sovereign financing needs, reinforcing the weakness. Domestic government securities can be attractive because of liquidity, collateral use, regulation and familiarity, but a strong concentration creates a common exposure rather than true diversification.
An institution can remain liquid for a time even after economic losses exhaust its capital, especially if losses are not promptly recognised or creditors do not withdraw. Continuing in that state can create incentives to “gamble for resurrection”: owners with little remaining value may prefer a high-risk strategy that benefits them if it succeeds while leaving much of the downside to creditors or public backstops. Prompt loss recognition and credible intervention address a solvency problem; an additional short-term loan alone cannot restore the missing asset value.
Deposit withdrawals and the remaining liquidity buffer
A run scenario asks how quickly the bank can meet withdrawals. Start with EUR 21,171 million of deposits and EUR 5,228 million of cash plus securities. Assume securities can be sold instantly at their stated values, are unencumbered and incur no transaction cost. These assumptions provide an upper-bound-style liquidity illustration, not a regulatory liquidity assessment. In a 20% withdrawal scenario, outflows are million, leaving million of liquid assets.
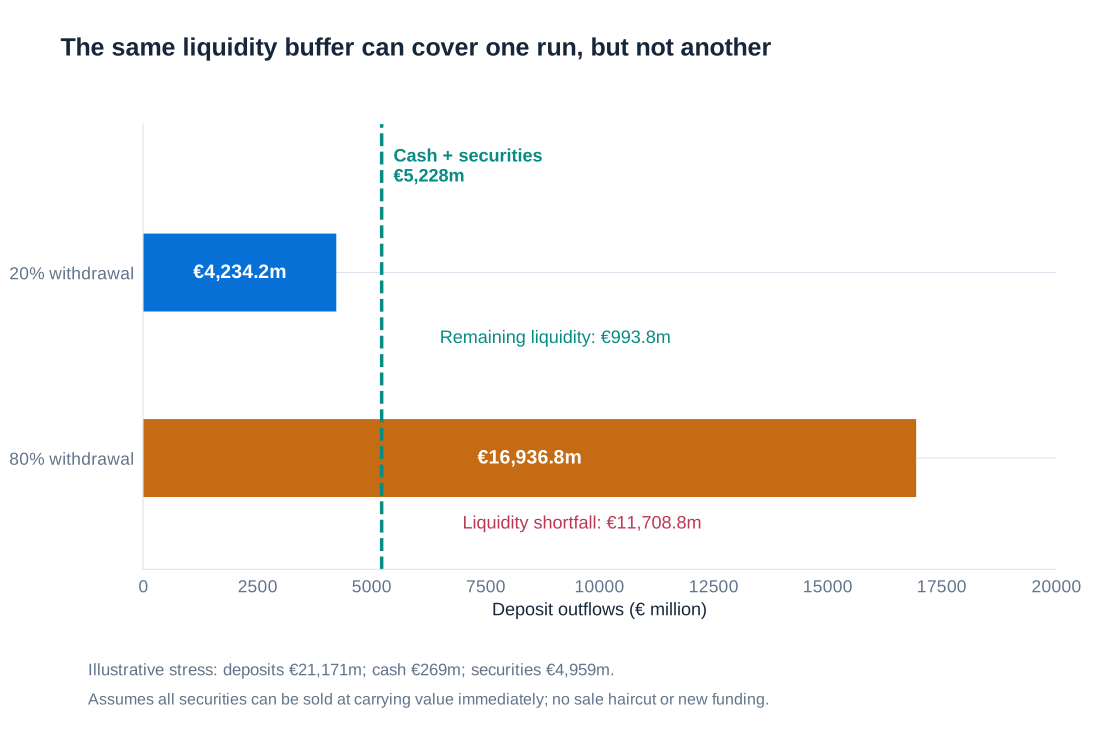
The immediate withdrawal can therefore be covered under these assumptions, but the institution is much less liquid afterwards. Its remaining deposit base is EUR 16,936.8 million, and, absent other changes, total assets shrink to EUR 18,489.8 million. Remaining liquid assets are only about 5.37% of that smaller balance sheet. Paying today's withdrawals is not sufficient if tomorrow's depositors view the depleted buffer as evidence that they should leave as well.
An 80% withdrawal instead requires million. Available cash and securities leave a shortfall of EUR 11,708.8 million. The bank would need additional funding, loan sales, collateralised borrowing or another source of liquidity to meet the scenario. Such options cannot be assumed costless or certain. Haircuts, unavailable collateral and simultaneous stress at other institutions can make the gap larger. Failure to pay under this scenario demonstrates illiquidity under the assumed resources; whether the bank is also insolvent requires an assessment of asset values and losses.
The same stresses affect different business models differently. A broker with matched customer cash arrangements and little lending can have a smaller direct sensitivity to loan losses, but falling markets, partner-bank problems and loss of customer confidence can damage its revenue or operations. A universal bank's derivatives and trading positions may either hedge or amplify rate and market shocks. Opaque asset positions make creditors uncertain about where losses lie, which can itself accelerate withdrawals. A useful stress test therefore specifies the shock, the balance-sheet transmission, behavioural assumptions and available management responses.
Strategy one: replacing equity with deposits
Consider three separate changes to the initial Sparkasse balance sheet. Each starts from the original amounts; they are not cumulative. To make the arithmetic transparent, assume the tax charge and all unmentioned income and expenses remain fixed. Incremental pretax earnings then change reported after-tax income euro for euro in this simplified exercise. This is an assumption about the calculation, not a realistic forecast of marginal taxation.
First replace EUR 200 million of equity funding with deposits while keeping total assets constant. Analytical equity falls from EUR 1,238 million to EUR 1,038 million and deposits rise to EUR 21,371 million. This can be understood as new deposit funding financing a distribution of capital. At the initial average deposit cost of , extra annual interest expense is approximately EUR 3.56 million. Profit falls from EUR 60 million to about EUR 56.44 million.
ROE has risen from 4.85% despite a reduction in total profit. The reason is that the equity denominator falls proportionately more than income. The change makes the institution more leveraged, reduces the buffer against asset losses and replaces permanent loss-absorbing funding with a claim that may be withdrawable. A higher ROE therefore does not establish that the bank has become more efficient or created more value after adjusting for risk.
Strategy two: replacing securities with loans
Next replace EUR 1 billion of securities with loans that earn one percentage point more. Assume, for the comparison, that both the old securities and new loans are free of credit losses. Total assets, deposits and analytical equity remain unchanged. Loans increase to EUR 18,124 million and securities fall to EUR 3,959 million. Incremental annual interest income is million, so profit rises to EUR 70 million under the fixed-tax assumption.
The loan-to-deposit ratio rises from 80.88%, while the liquid-assets ratio falls from 23.01%. These values use the same 2024 balance sheet throughout. The strategy improves the assumed earnings yield by reducing liquidity. It does not create credit risk within an exercise that explicitly assumes both assets are credit-risk-free; in an actual implementation, differences in borrower risk, capital requirements, origination cost and maturity would need to be added. Even a loan certain to repay eventually can be hard to sell before maturity, so liquidity risk remains possible under the risk-free-credit assumption.
Strategy three: accepting more credit risk
Finally replace the entire EUR 17,124 million loan book with loans earning 100 basis points more but requiring 50 basis points more in annual credit-loss provisions. One hundred basis points equals one percentage point. Additional interest income is EUR 171.24 million and additional provisioning is EUR 85.62 million, leaving EUR 85.62 million of extra profit under the fixed-tax assumption. New profit is EUR 145.62 million and .
The average yield on cash, securities and loans rises to . With the same deposit cost of 1.78%, the simplified yield–cost spread becomes about 2.12 percentage points. This is a substantial increase in reported expected profitability, but the higher provision captures only an assumed average loss cost. Unexpected losses, common borrower exposure, adverse selection, recovery uncertainty and larger capital needs can outweigh the apparent gain. Risk-adjusted profitability asks whether the extra return compensates for all these effects.
| Strategy | Main balance-sheet change | Net income (EUR million) | After-tax ROE | Risk implication |
|---|---|---|---|---|
| Initial position | Equity 1,238; loans 17,124; securities 4,959 | 60.00 | 4.85% | Starting comparison |
| Replace EUR 200m equity with deposits | Equity 1,038; deposits 21,371 | 56.44 | 5.44% | Less loss absorption and greater funding dependence |
| Replace EUR 1,000m securities with loans | Loans 18,124; securities 3,959 | 70.00 | 5.65% | Lower liquidity under the stated risk-free-credit assumption |
| Raise loan yield by 100bp and provisions by 50bp | Asset amounts unchanged; loan risk rises | 145.62 | 11.76% | Greater expected and unexpected credit exposure |
The three changes isolate different mechanisms: leverage changes the allocation of risk among funding providers, moving into loans changes liquidity, and riskier lending changes the distribution of asset returns. In practice these choices interact, but separating them first prevents a higher reported ROE from being mistaken for an unqualified improvement in the business.
Historical evidence from German banks
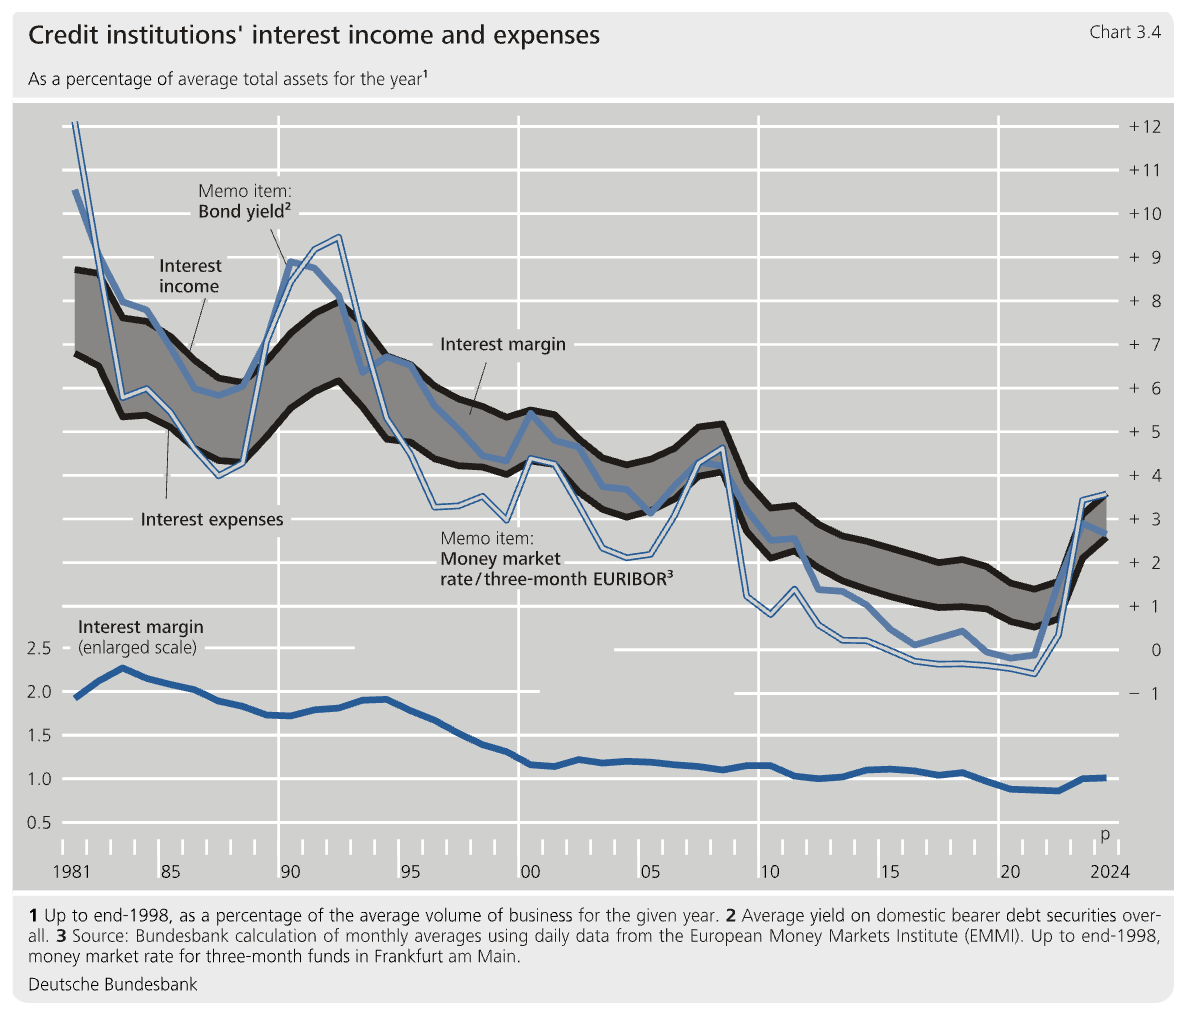
Aggregate data place individual institutions in context. The Bundesbank's historical interest series shows the long decline in nominal rates and gross interest flows, followed by the sharp repricing around 2022–2024. Interest income and expense move together over long periods, but not at the same speed. Their difference, expressed relative to the specified average asset base, is much smaller than either gross flow. The chart's historical note matters because the denominator used before 1999 is not identical to the later average-total-assets definition.
The 2024 income composition below shows that net interest income contributed 64.9% of operating income for all categories of German banks, net commission income 24.8%, trading income 7.1% and other operating results 3.2%. Savings banks and credit cooperatives depended more heavily on net interest income than big banks, which had larger fee and trading contributions. A category can exceed 100% for one revenue component when another component is negative; the percentages are a reconciliation of signed flows, not shares of positive revenues alone.
| Item | All banks | Big banks | Regional/other commercial | Landesbanken | Savings banks | Credit cooperatives | Mortgage banks | Building and loan associations | Special/central-support banks |
|---|---|---|---|---|---|---|---|---|---|
| Net interest income | 64.9 | 51.0 | 55.4 | 69.2 | 72.3 | 72.9 | 102.0 | 99.1 | 69.5 |
| Net commission income | 24.8 | 34.6 | 23.5 | 14.0 | 26.0 | 23.4 | -3.3 | -5.5 | 23.0 |
| Trading-portfolio result | 7.1 | 17.8 | 13.0 | 8.6 | 0.0 | 0.0 | 0.0 | 0.0 | 1.2 |
| Other operating result | 3.2 | -3.5 | 8.1 | 8.3 | 1.7 | 3.7 | 1.3 | 6.5 | 6.4 |
| Operating income | 100.0 | 100.0 | 100.0 | 100.0 | 100.0 | 100.0 | 100.0 | 100.0 | 100.0 |
| General administrative spending | -59.6 | -71.5 | -54.3 | -54.1 | -56.8 | -60.6 | -41.4 | -70.4 | -56.7 |
| Of which: staff costs | -30.2 | -30.9 | -25.1 | -27.2 | -34.0 | -33.6 | -19.5 | -27.4 | -28.9 |
| Of which: other administrative spending | -29.4 | -40.6 | -29.2 | -26.9 | -22.8 | -27.0 | -21.9 | -43.1 | -27.8 |
| Result from valuation of assets | -8.0 | -9.1 | -7.2 | -16.0 | -5.9 | -7.8 | -8.2 | -3.2 | -7.9 |
| Other and extraordinary result | -1.4 | 6.9 | -9.1 | 2.9 | -0.6 | -0.6 | -19.2 | -9.5 | -6.9 |
“Result from the valuation of assets” is broader than a pure loan-default measure: its precise coverage follows the Bundesbank's accounting classification. Describing the entire 8.0% charge as realised loan losses would erase that distinction. Administrative costs also differ across business models, so a higher share need not prove worse operating efficiency without considering the services supplied and revenue mix.
| Category | 2020 | 2021 | 2022 | 2023 | 2024 |
|---|---|---|---|---|---|
| All categories of banks | 2.71 / 1.12 | 5.03 / 3.22 | 4.83 / 3.86 | 8.36 / 6.18 | 8.43 / 6.14 |
| Commercial banks | −1.56 / −2.95 | 2.65 / 1.41 | 6.05 / 5.97 | 9.16 / 7.02 | 10.00 / 7.18 |
| Of which: big banks | −7.08 / −8.22 | −2.26 / −2.13 | 9.12 / 12.29 | 12.12 / 11.91 | 11.81 / 9.26 |
| Of which: regional and other commercial banks | 4.10 / 2.46 | 6.00 / 3.81 | 4.27 / 2.25 | 7.49 / 4.15 | 9.06 / 6.02 |
| Landesbanken | 1.29 / 0.84 | 4.02 / 2.26 | 4.77 / 2.72 | 7.45 / 5.01 | 8.84 / 7.31 |
| Savings banks | 5.36 / 3.36 | 6.27 / 4.22 | 4.74 / 2.82 | 10.17 / 7.09 | 10.34 / 7.25 |
| Credit cooperatives | 7.31 / 4.98 | 8.37 / 6.19 | 4.59 / 3.46 | 8.92 / 6.47 | 7.92 / 5.53 |
| Mortgage banks | 8.06 / 1.40 | 16.91 / 5.73 | 5.99 / 3.76 | 8.89 / 5.69 | 7.95 / 4.47 |
| Building and loan associations | 1.66 / 0.86 | 1.41 / 0.50 | 2.79 / 1.65 | 4.14 / 1.99 | 3.60 / 3.17 |
The return-on-equity series reports pretax values with after-tax values separately identified. For all categories, pretax ROE rises from 4.83% in 2022 to 8.36% in 2023 and 8.43% in 2024; the corresponding after-tax values are 3.86%, 6.18% and 6.14%. This improvement is consistent with a period in which asset income benefited from rising rates before all funding costs caught up. It does not imply that every institution benefited or that the same margin persists after deposit repricing and borrower stress. These ratios use annual average equity as defined in the statistical series, including the fund for general banking risks, rather than the year-end denominator of the earlier simplified example.
Historical aggregate data: Deutsche Bundesbank, The performance of German credit institutions in 2024, September 2025. The tables retain the report's preliminary 2024 status and accounting definitions.
Valuation, policy uncertainty and the deposit franchise
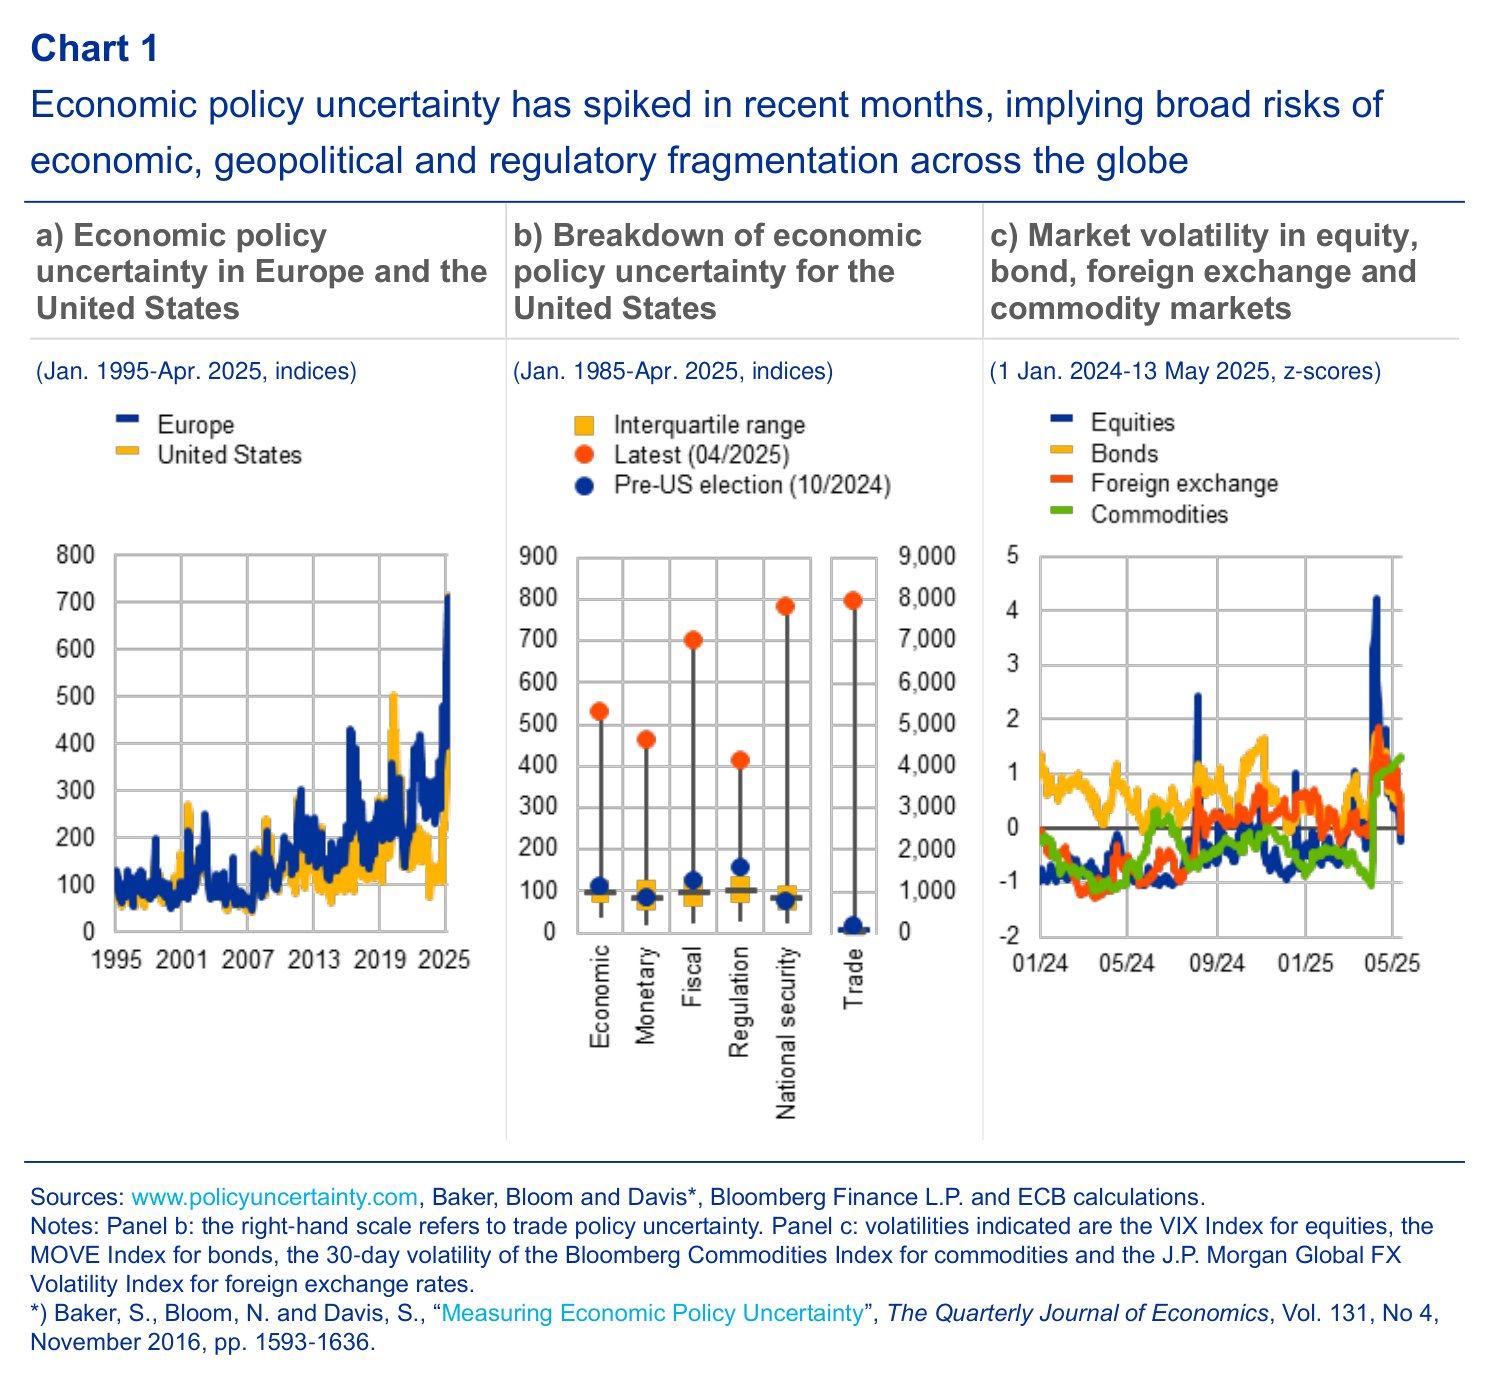
Market valuations add a forward-looking dimension to accounting performance. The ECB's May 2025 exhibits show a period of sharply elevated policy uncertainty alongside changing bank valuations and profitability. The uncertainty indices, market-volatility measures and bank price-to-book ratios have different units and should be interpreted separately. A high uncertainty reading is not itself a quantified bank loss; it indicates an environment in which investment decisions, funding conditions and asset prices may change abruptly.
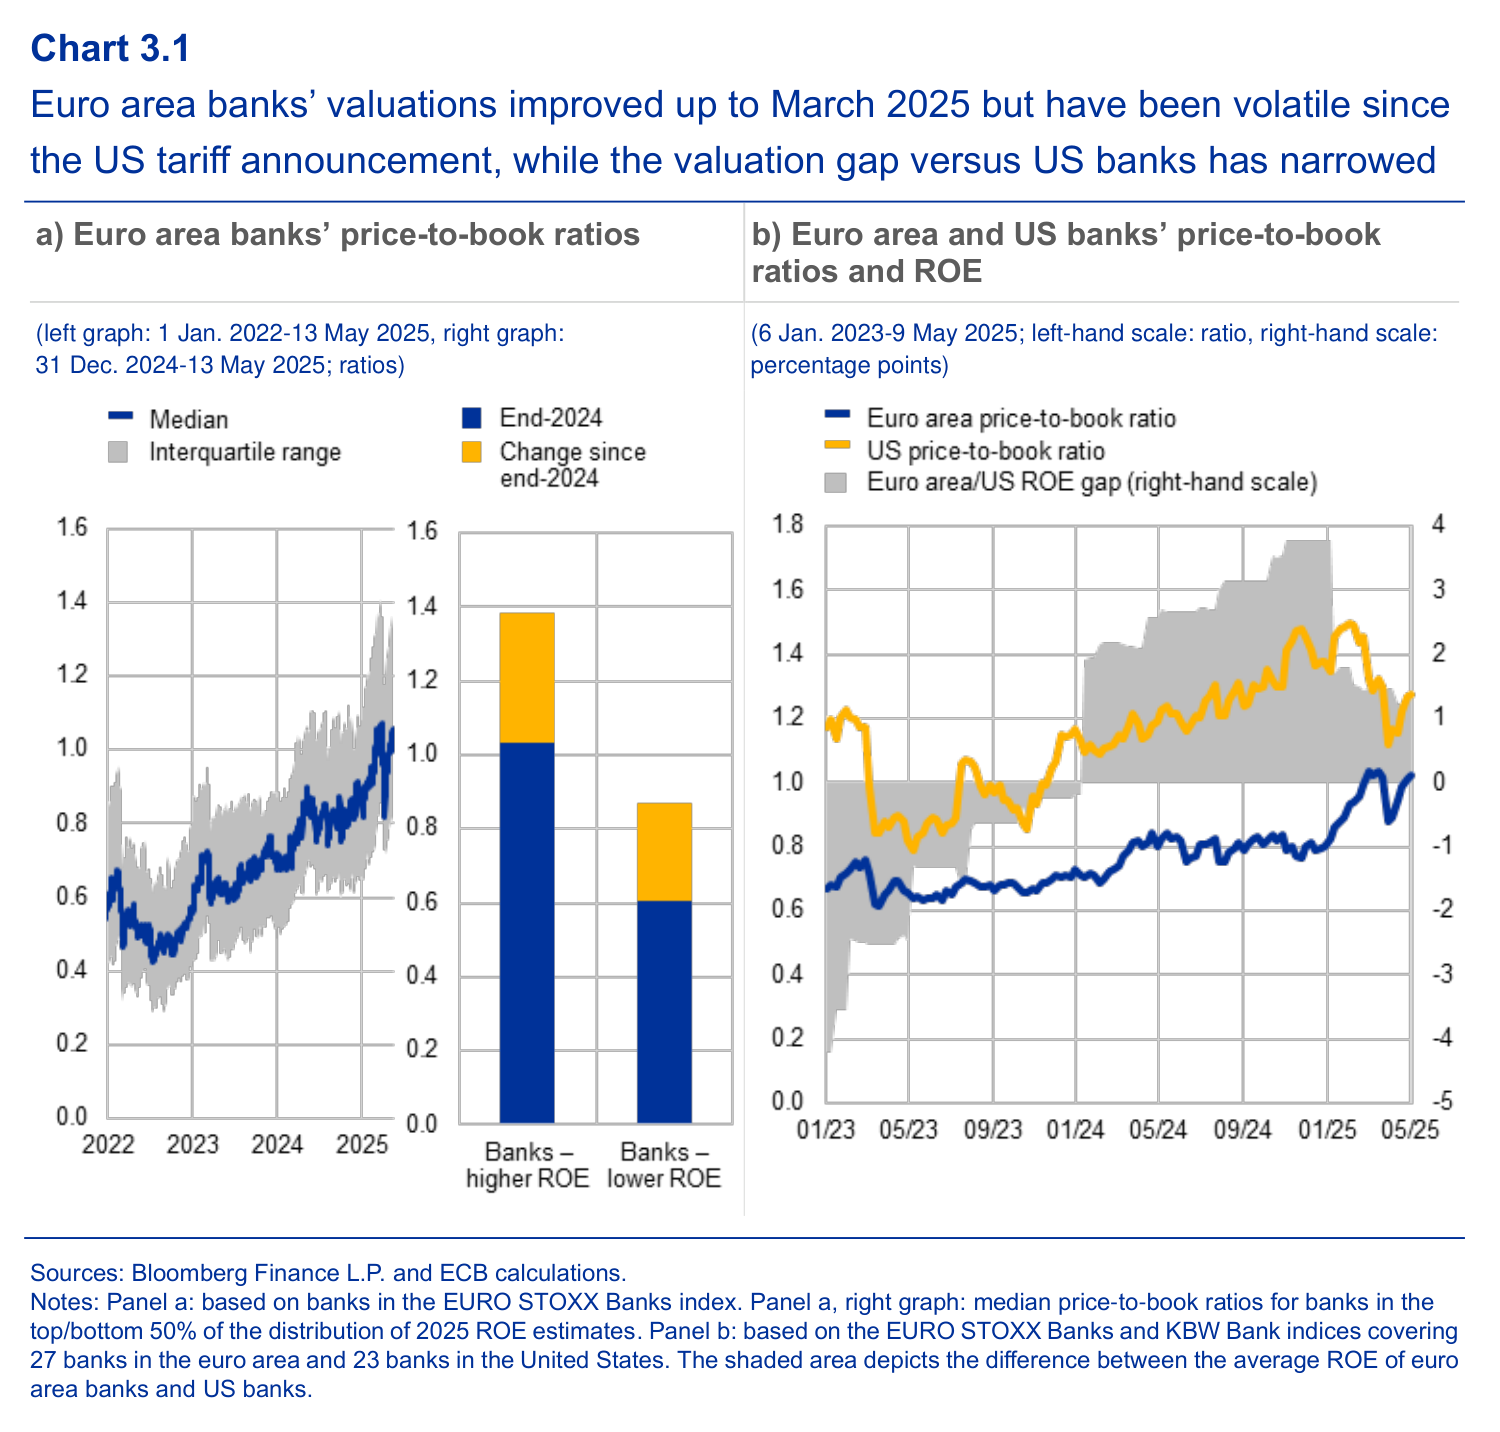
A price-to-book ratio compares the market value of equity with its accounting value. It can rise when investors expect more persistent earnings or require a lower risk premium; it can fall when they anticipate losses, dilution or poor future returns. A ratio below one does not by itself prove that a bank is insolvent. The ECB's 2025 comparison links valuation differences to profitability, but differences in business models, accounting and expected growth remain relevant when comparing the euro area with the United States.
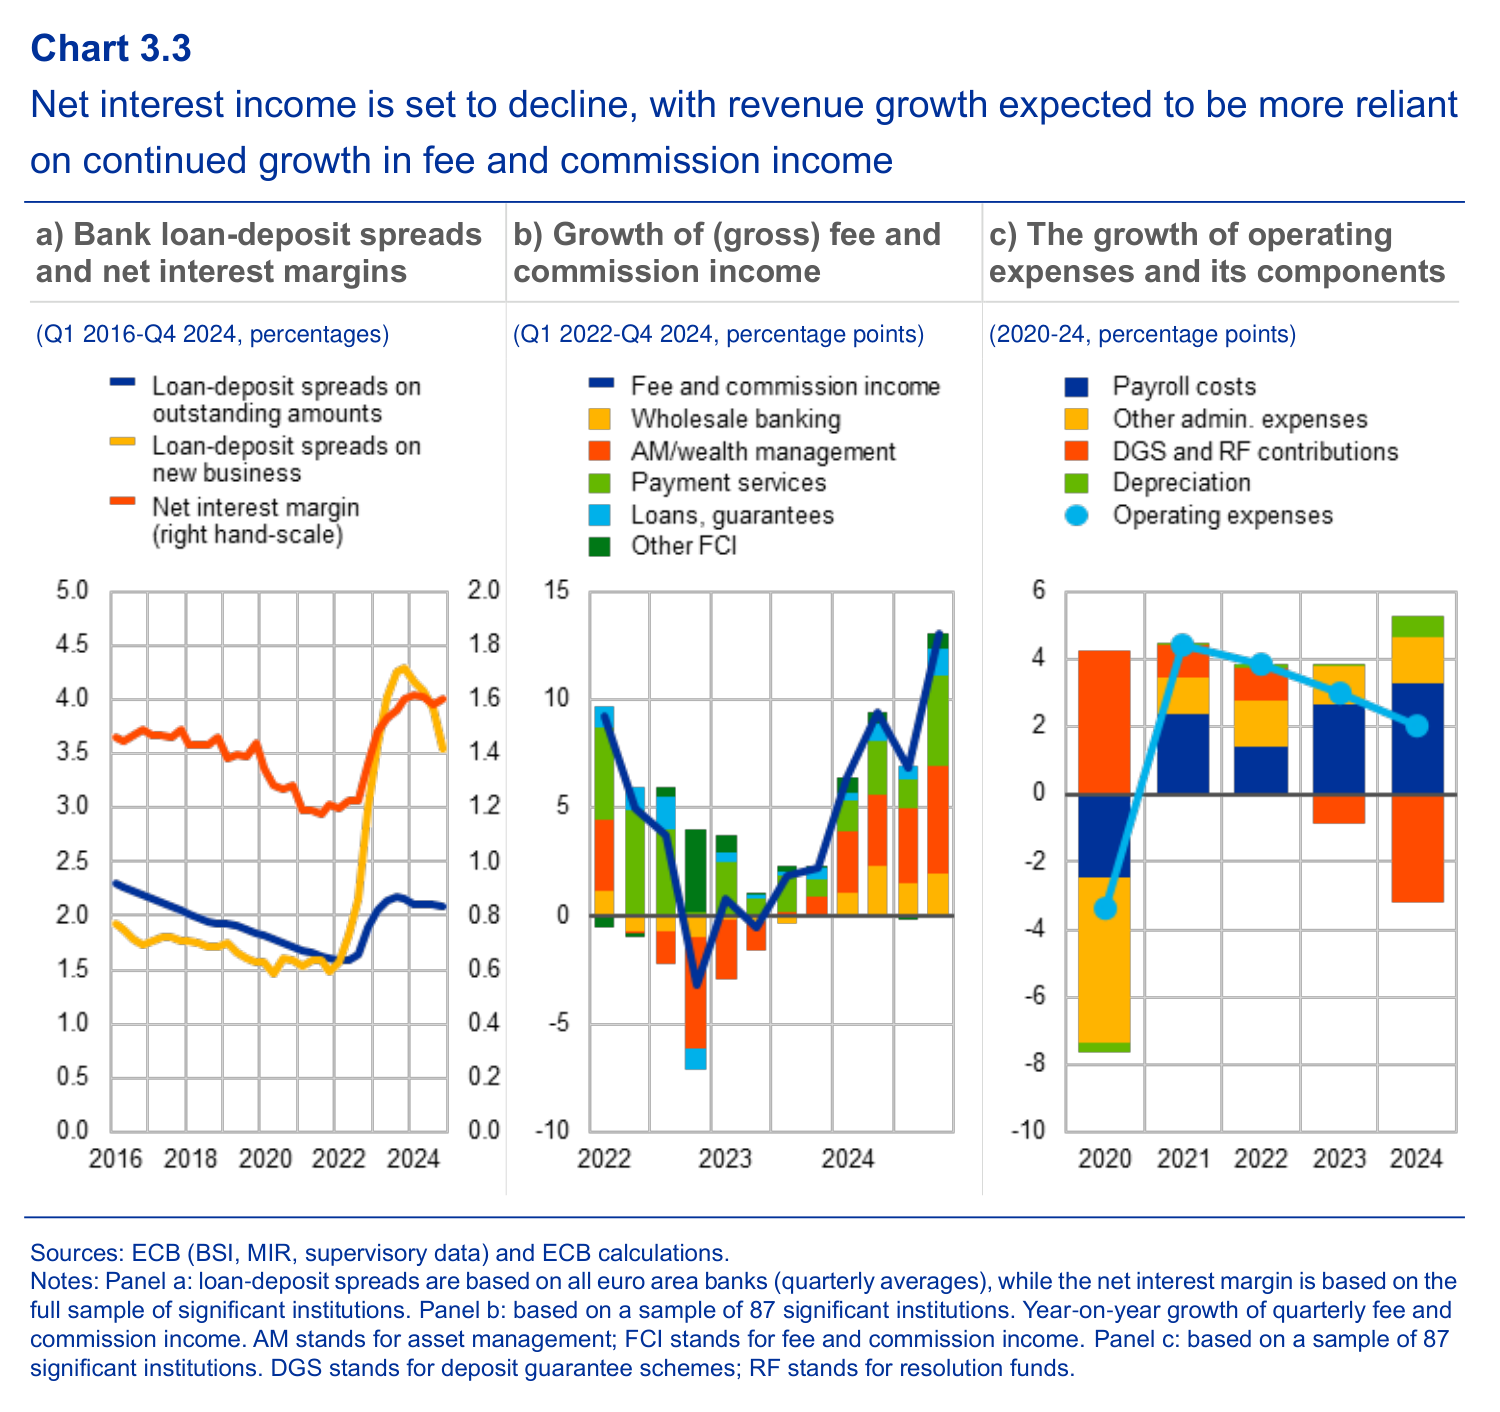
The profitability panels distinguish loan–deposit spreads, net interest margins, fee-income growth and changes in operating costs. A lender can experience a narrower new-business spread while its outstanding fixed-rate book reprices only gradually. An asset manager can earn more fees because client portfolios appreciate even without receiving new client money. Staff costs, deposit-guarantee contributions, resolution-fund contributions and depreciation can move differently. A credible earnings analysis therefore decomposes changes instead of attributing the whole profit movement to one policy rate.
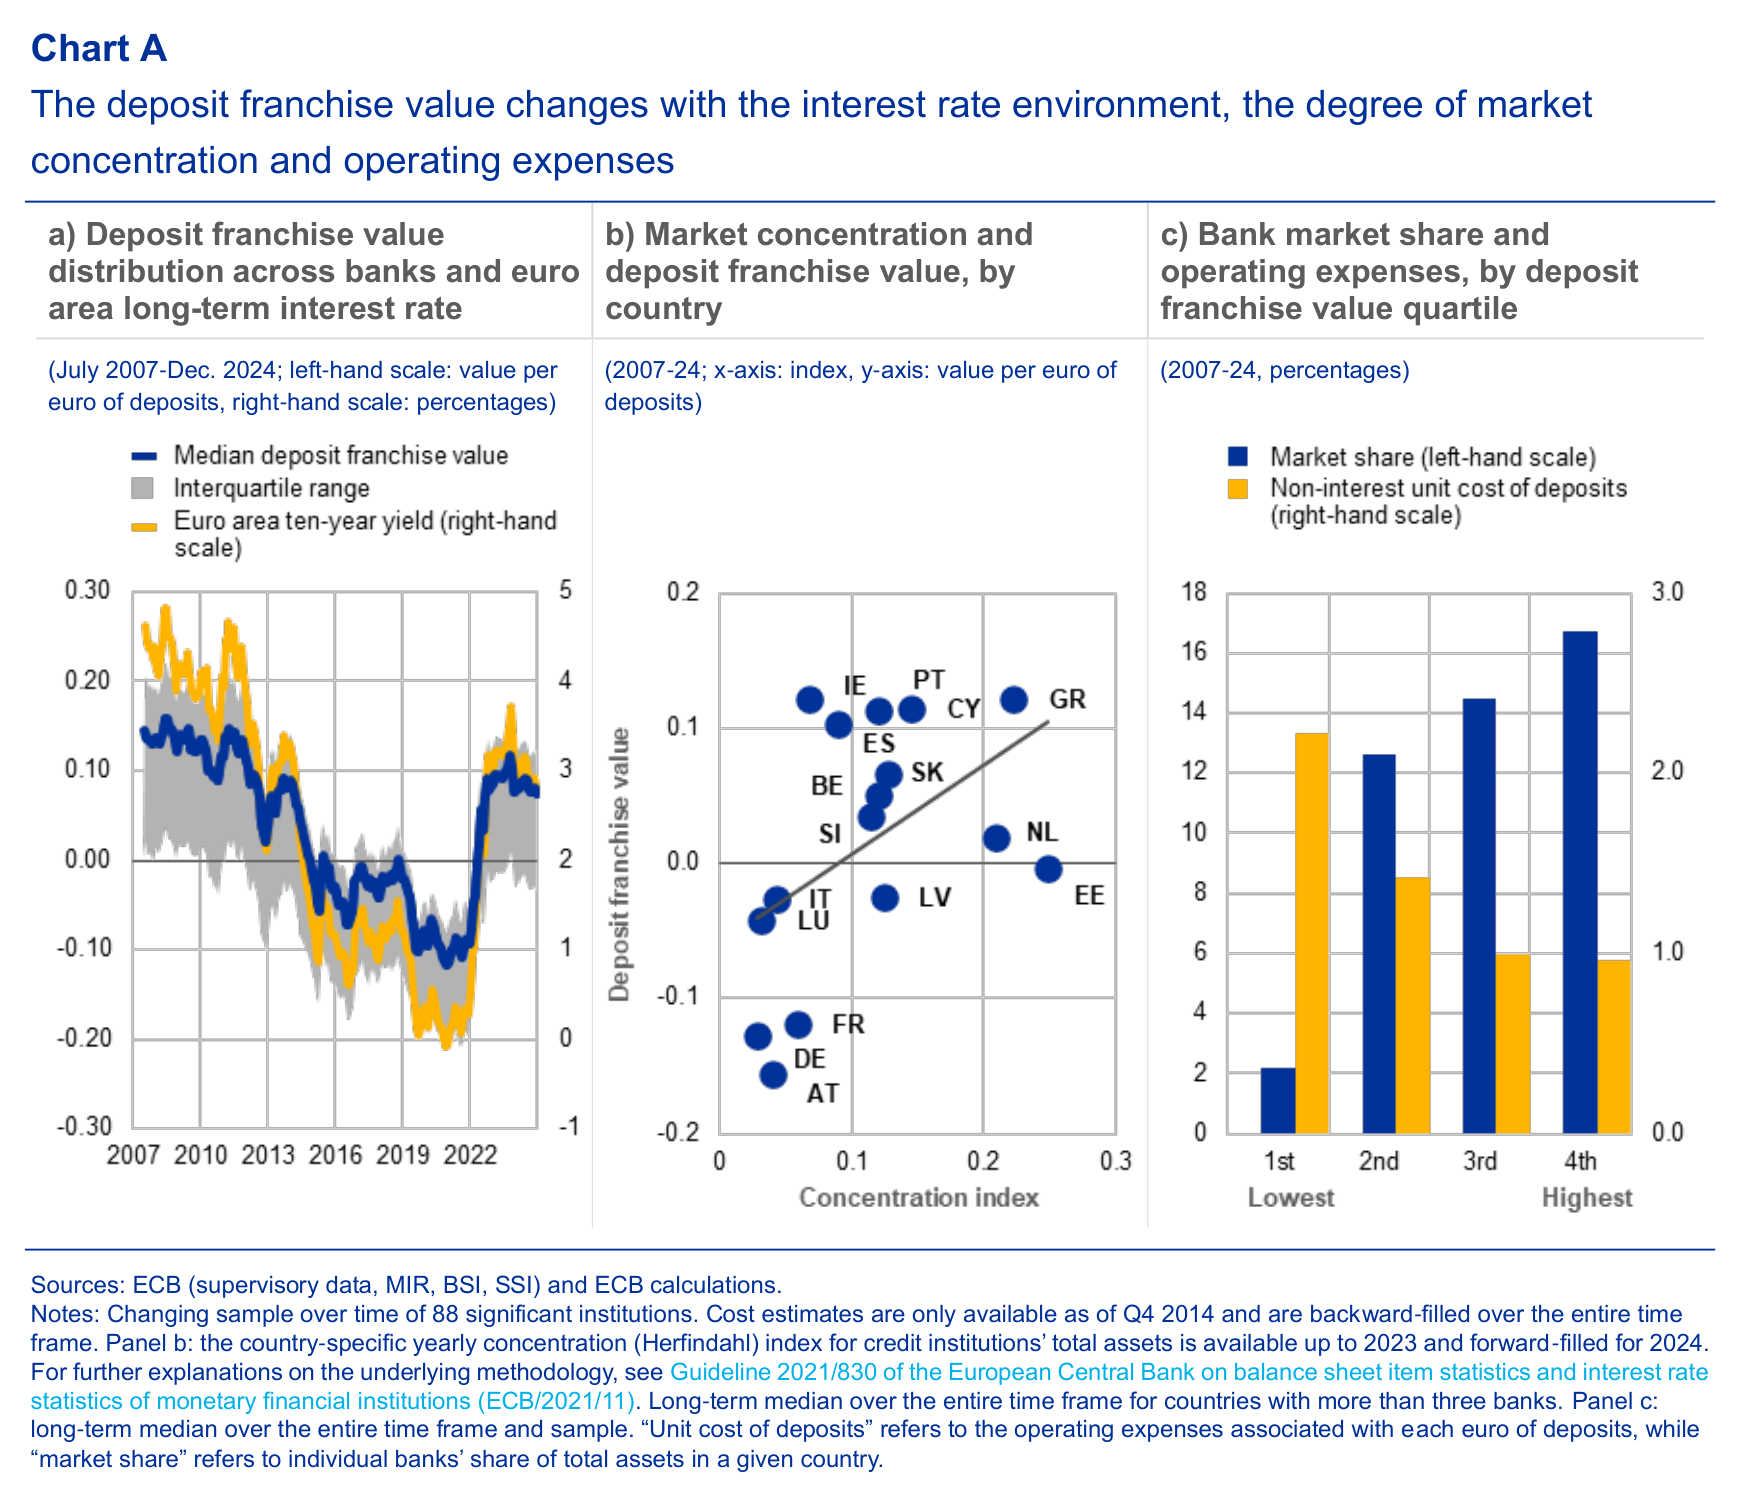
The deposit franchise is the economic value of a bank's ability to maintain customer funding on favourable terms after paying the costs of providing account services. Customers value payment access, convenience, safety and an established relationship, so deposit remuneration need not immediately equal a wholesale market rate. When market rates rise faster than deposit rates, the funding advantage can increase. Competition, customers moving to term deposits, online comparison tools and withdrawals can later erode it. Maintaining the franchise also requires spending on technology, branches, service and compliance.
A constructed present-value expression makes the mechanism explicit. Let be expected deposits, the cost of comparable alternative funding, the deposit rate, the costs attributable to serving those deposits and an appropriate discount rate. Then a simplified franchise value is
This is a valuation framework rather than a measured number for a specific bank. It depends on deposit persistence, pricing, costs and risk. A large balance of expensive or unstable deposits can be less valuable than a smaller stable customer base. The franchise value is also not a stock of immediately available cash: relying on it to cover today's withdrawals would confuse expected future earnings with liquidity.
Historical European context: European Central Bank, Financial Stability Review, May 2025, including its analysis of deposit-franchise value. Accounting context for expected losses: BIS Financial Stability Institute, IFRS 9 and expected loss provisioning.
Financial statements are therefore a starting point for judgement. A robust assessment connects the asset mix, funding structure, income sources, loss recognition and available liquidity. Profitability that comes from an efficient service is economically different from profitability achieved by reducing capital, accepting illiquidity or increasing unrecognised risk. The numerical examples establish a discipline that applies throughout banking: state the denominator, specify the shock, reconcile the arithmetic and explain what the result does and does not measure.