
5. Investment Banking, Syndication and Securitisation
Investment banking connects companies that need capital with investors willing to supply it. The intermediary may advise on an acquisition, arrange a syndicated loan, underwrite a bond or share issue, distribute securities, or structure claims against a portfolio of loans. These activities complement commercial banking: the same banking group may hold a corporate loan, organise its distribution and later advise the borrower on refinancing. Understanding the economic function therefore requires following the cash flows, information and contractual obligations, rather than relying on the institution’s name.
Three arrangements illustrate these connections. Syndication spreads one borrower’s financing among several lenders. Securitisation pools assets and reallocates their cash flows among investors with different priorities. Acquisition finance coordinates commitments and permanent funding across the uncertain interval between agreeing a transaction and completing it. Each can improve access to finance, but each also creates an agency problem: the intermediary arranging a transaction may know more than the investors who ultimately bear its risk.
Investment-banking services and what league tables measure
Corporate-finance services cover mergers and acquisitions, equity and debt issuance, and syndicated lending. Research helps clients interpret companies, securities and markets; securities and derivatives trading provides execution, market making and risk transfer. Investment management serves private wealth and institutional portfolios. These functions bring issuers and investors together but need not all be undertaken by the same legal entity. An underwriter committing to buy an issue bears a different risk from an adviser paid for advice or a distributor operating on a best-efforts basis. Revenue from fees also differs from the profits and losses generated by holding trading inventory or loans.
Combining services can create conflicts of interest. An intermediary may advise an issuer while selling securities to investors, financing a bidder or trading related instruments. Confidential information, research independence, disclosure and clear allocation of responsibilities matter because the clients do not necessarily share the same objectives. A successful distribution is not by itself evidence that the product suits every buyer.
League tables rank activity under a defined methodology. The historical table below records investment-banking fee estimates for calendar 2024, in a snapshot dated 10 July 2025. It illustrates differences in business mix: some institutions earned a larger proportion from merger advice, others from bonds or loans. The “market total” is the total reported market, not the sum of the ten institutions. Rounded product percentages need not sum exactly to 100. Neither gross fees nor a high rank demonstrates superior profitability, capital efficiency or advice quality.
| Institution | Fees, USD m | Change | M&A share | Equity share | Bonds share | Loans share |
|---|---|---|---|---|---|---|
| JPMorgan | 9,373.98 | +27% | 32% | 17% | 24% | 27% |
| Goldman Sachs | 7,261.67 | +23% | 47% | 17% | 19% | 16% |
| BofA Securities | 6,624.60 | +27% | 22% | 14% | 29% | 35% |
| Morgan Stanley | 5,903.70 | +33% | 38% | 24% | 23% | 15% |
| Citi | 4,740.90 | +30% | 26% | 17% | 34% | 24% |
| Barclays | 3,538.96 | +18% | 23% | 14% | 36% | 26% |
| Wells Fargo | 2,781.51 | +30% | 12% | 8% | 39% | 40% |
| BNP Paribas | 2,498.77 | +25% | 14% | 6% | 49% | 32% |
| RBC Capital Markets | 2,428.66 | +22% | 23% | 8% | 35% | 34% |
| Jefferies | 2,421.11 | +49% | 46% | 22% | 10% | 22% |
| Reported market total | 120,764.79 | +17% | 29% | 13% | 33% | 25% |
Historical data: Financial Times investment-banking league-table snapshot, 10 July 2025, covering 1 January–31 December 2024. This dated illustration is not a current ranking.
A syndicated loan as a coordinated lending contract
A syndicated loan is credit granted by a group of lenders to one borrower under a common agreement. A mandated lead arranger negotiates the principal terms and coordinates the transaction. The bookrunner seeks commitments and allocates amounts among participants; an administrative agent handles notices, payments and contractual administration. Participating lenders provide agreed shares of the funding and normally have separate claims against the borrower. Lenders within the same tranche generally rank equally, but a facility can contain tranches with different currencies, maturities, security or priorities. “One agreement” does not mean that every lender jointly guarantees every other lender’s obligations.
Syndicated lending lies between bilateral relationship lending and bond finance. A bilateral loan is negotiated with one lender and is often comparatively easy to amend; it can nevertheless be transferable subject to consent and other restrictions. Syndicated loan interests often trade in a secondary market, though transfer restrictions and settlement frictions matter. Bonds normally offer greater standardisation and potentially wider distribution, while renegotiation may be harder when ownership is dispersed. Liquidity is a matter of degree: neither a bond listing nor a loan’s legal transferability guarantees an active market.
| Feature | Bilateral loan | Syndicated loan | Bond |
|---|---|---|---|
| Initial financing relationship | Borrower and one lender | Borrower and coordinated lender group | Issuer and securities investors |
| Typical information channel | Private lender information | Shared contractual reporting to lenders | Offering and continuing disclosures |
| Amendments | Direct negotiation | Contractual voting and consent thresholds | Security terms and bondholder consent rules |
| Transfer | May be restricted | Often permitted subject to agreement | Generally transferable, with market liquidity varying |
The historical Starwood Hotels & Resorts Worldwide facility shows how titles correspond to functions. A USD 250 million, two-year term loan signed on 30 May 2001 was arranged for general corporate purposes. Its quoted margin was LIBOR plus 125 basis points, with a 17.5-basis-point commitment fee. Deutsche Bank acted as mandated arranger, bookrunner and administrative agent; the participant group included Deutsche Bank, Bank One, Citibank, Crédit Lyonnais and UBS. The arranger designed and syndicated the transaction, whereas participants supplied funds. A commitment fee compensates for making capacity available under the specified contract; it should not automatically be applied to the same base as interest on outstanding principal.
Why borrowers, arrangers and participants choose syndication
For a borrower, syndication can replace numerous separate negotiations with a coordinated facility, increase the amount available and improve the combination of price and non-price terms. Private reporting to lenders can also preserve commercial confidentiality compared with a public securities offering. This is relative confidentiality, not freedom from all disclosure: listed issuers may still have legal reporting duties, and lenders require substantial information. A common agreement makes amendment possible without negotiating entirely separate contracts, although voting thresholds and conflicting lender interests can still obstruct restructuring.
For the arranger, a large loan may exceed an economic concentration limit or an applicable regulatory exposure limit if retained in full. Distribution reduces the retained exposure, earns arrangement and underwriting fees, and can support a wider client relationship. For participants, the deal offers diversification across borrowers, sectors or countries and uses lending capacity that their own origination network may not fill. It can also establish new client relationships. These benefits are conditional: buying another loan in an already crowded sector does not diversify that bank merely because the loan is syndicated.
The arranger’s information advantage creates a delegated-screening problem. Participants may rely excessively on the arranger, while an arranger planning to distribute most of the exposure may have weaker incentives to investigate. Retained exposure, reputation, contractual information duties and the participants’ own diligence help align incentives. Non-bank lenders, including collateralised loan obligations and investment funds, are particularly important in lower-rated term loans. Their participation redistributes credit risk away from deposit-funded banks, but banks may remain exposed through retained loans, underwriting commitments, credit lines and relationships with the new holders.
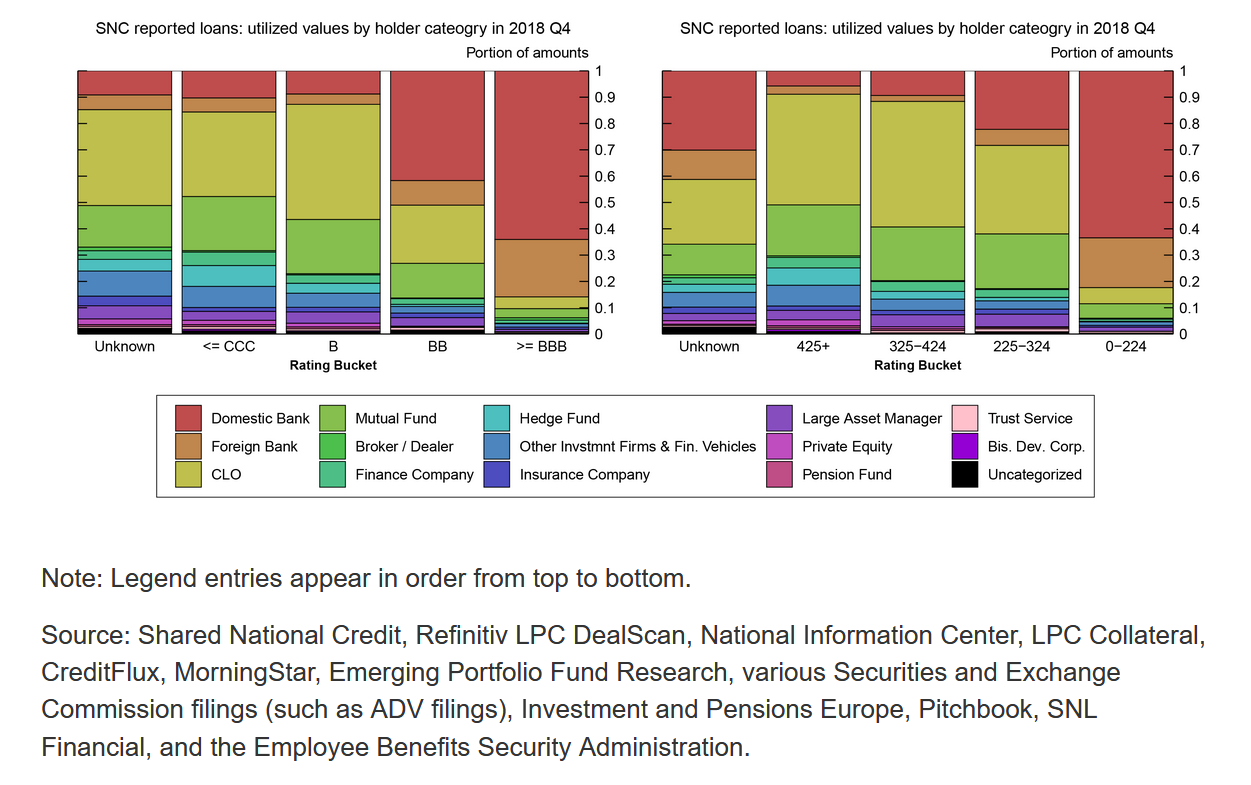
A historical 2024 market estimate placed global syndicated lending near USD 5.9 trillion, including approximately USD 3.9 trillion in the Americas, USD 1.0 trillion in Europe and USD 0.6 trillion in Asia-Pacific excluding Japan; the selected regional categories are not an exhaustive decomposition. Large reported transactions in 2024–25 included ByteDance’s USD 10.8 billion refinancing and Nippon Steel’s acquisition financing, with a JPY 2 trillion bridge and subsequent JPY 800 billion subordinated funding. PIF’s USD 15 billion revolving facility, announced in August 2024, involved 23 international institutions and replaced its 2021 facility. These examples distinguish refinancing existing debt, funding an acquisition and maintaining general liquidity: the same broad contractual form can serve different purposes.
The holdings figure is a historical Federal Reserve analysis of 2018 Q4: The U.S. Syndicated Term Loan Market: Who holds what and when? The market-volume and ByteDance/Nippon examples are dated LSEG/Reuters estimates; PIF confirms its facility in its August 2024 announcement.
Reading performance pricing: the eBay facility
A revolving credit facility promises access to borrowing up to an agreed limit, with drawings and repayments governed by the agreement. Commitment and utilisation are therefore different quantities. eBay’s agreement dated 22 November 2011 provided a USD 3 billion revolver, with JPMorgan as administrative agent and several arranging and agency banks. Its pricing grid linked the interest margin and commitment fee to the borrower’s debt ratings. A basis point is 0.01 percentage points: a margin of 0.625% is 62.5 basis points, added to the relevant benchmark rather than substituted for it.
| Level and rating category | Eurocurrency margin | Alternative base-rate margin | Commitment fee |
|---|---|---|---|
| I: at least AA− / Aa3 | 0.625% | 0.000% | 0.050% |
| II: A+ / A1, below I | 0.750% | 0.000% | 0.060% |
| III: A / A2, below I–II | 0.875% | 0.000% | 0.080% |
| IV: A− / A3, below I–III | 1.000% | 0.000% | 0.100% |
| V: below IV | 1.125% | 0.125% | 0.150% |
The rating labels summarise the S&P/Fitch and Moody’s categories shown in the historical agreement; the contract’s rules resolve split ratings. The agreement also required consolidated interest coverage of at least 3.00 times at each fiscal-quarter end. Interpreting that requirement needs the agreement’s definitions of earnings, interest expense and the consolidation perimeter. A ratio with the same name in a financial database may use a different numerator or denominator.
Benchmark continuity is another contractual issue. If the published reference rate disappears, the parties need a fallback, replacement mechanism or amendment; a quoted spread alone cannot determine interest. LIBOR in these historical examples is not a current available benchmark: the final synthetic settings ceased after 30 September 2024. Modern agreements commonly specify alternative benchmarks, associated conventions and adjustment mechanisms. The economic lesson is to read the benchmark clause, day-count convention, margin, fees, floor and fallback together.
Historical contract: eBay credit agreement dated 22 November 2011. For benchmark cessation, see the FCA’s confirmation of the end of LIBOR.
Why pricing grids and covenants are complements
Performance pricing changes the cost of debt as measured credit quality changes. It rewards stronger finances with a lower spread and increases compensation when leverage rises, earnings weaken or ratings fall. It can also screen applicants: a borrower privately expecting deterioration has less reason to accept a sharply increasing future spread. Managerial optimism can influence the perceived attractiveness of such a contract, but it is not valid to assume that every manager is overoptimistic. The mechanism works only to the extent that the chosen metric is informative and sufficiently resistant to manipulation.
| Level | Spread over LIBOR | Debt-rating category | Interest-coverage range |
|---|---|---|---|
| 1 | 0.30% | A2 / A or higher | At least 6.25 times |
| 2 | 0.35% | A3 / A− | At least 5.75, below 6.25 |
| 3 | 0.40% | Baa1 / BBB+ | At least 5.00, below 5.75 |
| 4 | 0.55% | Baa2 / BBB | At least 4.50, below 5.00 |
| 5 | 0.65% | Baa3 / BBB− | At least 3.75, below 4.50 |
| 6 | 0.80% | Below Baa3 / BBB− | Below 3.75 |
The same historical agreement imposed a maximum contract-defined leverage ratio of 0.62 and minimum interest coverage of 3.25 times. The grid’s lowest coverage band starts below 3.75, while the covenant is breached below 3.25; these thresholds are related but not identical. Pricing handles a range of deterioration while the covenant provides a separate intervention point. A breach can trigger consent requirements, renegotiation, restrictions or contractual remedies; it does not automatically mean immediate liquidation.
Why not simply keep increasing interest rates? Higher interest expense can further reduce coverage and creditworthiness, prompting another rate increase. At sufficiently severe distress, this feedback can damage repayment capacity rather than protect lenders. Covenants let the parties address behaviour and control rights instead of relying only on price. Short maturities are an imperfect substitute: refinancing frequently allows repricing and reassessment, but exposes the borrower to the possibility that funding disappears entirely. This rollover risk is different from paying a pre-agreed higher spread. Short-term lending is particularly relevant where detailed performance metrics or enforceable covenants are difficult to apply.
From loan origination to asset-backed securities
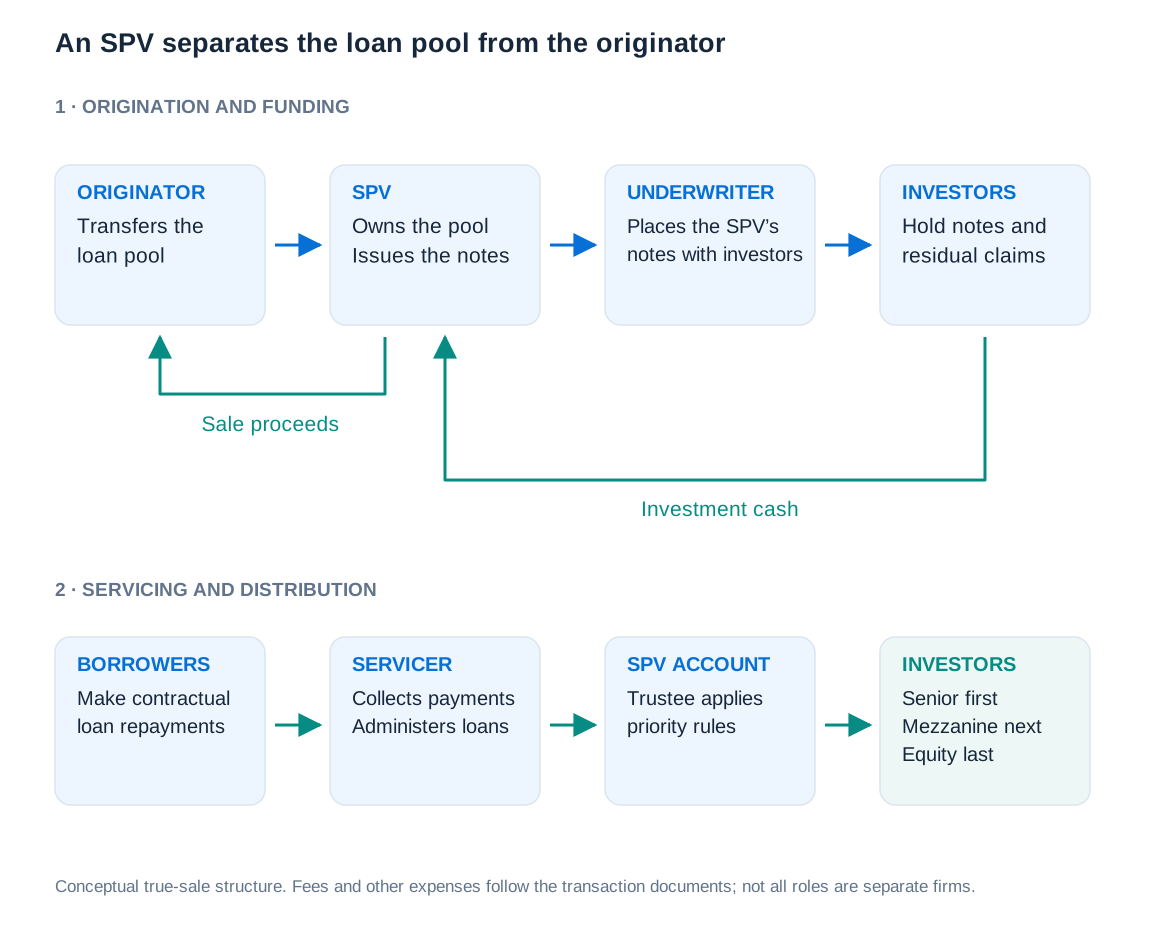
Securitisation converts cash flows from an asset pool into securities. In a typical cash transaction, an originator sells receivables to a special-purpose vehicle, which finances the purchase by issuing notes. Borrowers continue to make principal and interest payments; the servicer collects these and administers defaults, while a trustee or paying agent distributes amounts according to the contract. An underwriter helps design and place the securities. Credit enhancement may come from subordination, excess collateral, reserves or a third-party guarantee, for which a fee may be charged. Fees reduce the resources ultimately available to investors and must be included in valuation.
The vehicle and the underwriter are distinct roles, even when related companies perform several functions. Asset isolation depends on legal structure, enforceability and insolvency treatment, not merely on calling an entity “special purpose”. Accounting derecognition and regulatory capital relief also require their own conditions. Synthetic securitisations transfer specified credit risk without necessarily selling the underlying loans. In either form, risk transfer should be assessed economically: retained junior tranches, liquidity commitments or implicit support can leave the originator exposed.
| Category | Typical underlying claims | Interpretive distinction |
|---|---|---|
| RMBS | Residential mortgages | Residential mortgage-backed securities |
| CMBS | Commercial property mortgages | Cash flows depend on commercial borrowers and property income |
| CLO | Corporate loans | A collateralised loan obligation is commonly treated as a form of CDO |
| CBO / broader CDO | Bonds or other debt claims | Collateralised bond/debt obligations describe the collateral mix |
| ABS in the narrower sense | Auto and consumer loans, credit cards, equipment leases, student loans and trade receivables | Excludes categories separately reported as MBS or CDO/CLO |
| Specialised receivables | Dealer floorplans, insurance premiums, aircraft leases, film or health-care receivables, music royalties and lottery payments | Requires pool-specific legal and cash-flow analysis |
“ABS” can therefore be an umbrella term for asset-backed securities generally or a narrow statistical category. Life-insurance-related claims and externally guaranteed, or “wrapped”, securities add other risks, including insurance-event assumptions and guarantor creditworthiness. The label alone does not establish the quality, maturity or liquidity of the investment.
Reading securitisation market statistics without mixing stocks and flows
Issuance measures securities created during a period; outstanding volume measures securities still in existence on a date. A stock accumulates past issuance net of repayments and other changes. Currency, geographic coverage and classification must match before comparing totals. Agency mortgage securities are especially important in the United States, reflecting the role of agency/GSE-related mortgage finance, whereas European classifications separately identify substantial SME and other collateral pools.
| Collateral category | Issuance |
|---|---|
| ABS | 62.7 |
| CDO/CLO | 49.2 |
| CMBS | 2.8 |
| RMBS | 120.4 |
| SME | 9.8 |
| Corporate | 0.0 |
| Total | 244.9 |
| Collateral category | Issuance |
|---|---|
| ABS | 280.1 |
| CDO | 78.2 |
| Agency MBS | 1,122.4 |
| Non-agency CMBS | 46.3 |
| Non-agency RMBS | 21.3 |
| Total reported | 1,548.4 |
The regional classifications differ, so categories with similar names should be checked before comparison. The published US total differs by 0.1 from the sum of rounded components. For outstanding securities, the retained historical snapshots are deliberately dated separately below. They cannot be interpreted as a same-date comparison or as growth from one region to the other.
| Collateral | Outstanding |
|---|---|
| Auto | 71.9 |
| Cards | 26.0 |
| SME ABS | 114.4 |
| CMBS | 29.8 |
| Consumer | 88.1 |
| Leases | 10.6 |
| RMBS | 539.0 |
| Other | 47.1 |
| Total excluding CLO/CDO, reported | 926.8 |
| CLO/CDO | 235.6 |
| Total including CLO/CDO | 1,162.4 |
| Collateral | Outstanding |
|---|---|
| ABS | 1,386.5 |
| Agency MBS | 8,134.8 |
| Non-agency RMBS | 734.4 |
| Non-agency CMBS | 588.4 |
| Total | 10,844.1 |
Historical AFME/SIFMA data; European component totals may differ by 0.1 due to rounding. The AFME Q1 2025 historical data snapshot confirms calendar-2024 issuance totals of EUR 244.9 billion for Europe and EUR 1,548.4 billion for the United States. The older US stock appears in AFME’s historical outstanding-volume tables, denominated in EUR billion.
Tranche priorities, attachment points and the loss waterfall
Tranching creates different claims against the same pool. Senior investors receive priority; mezzanine investors absorb losses after the first-loss position is exhausted; the equity tranche receives the residual. Seniority can support a high credit rating but does not automatically imply AAA or eliminate risk. The equity tranche may have a high expected return, yet it is a residual claim, not necessarily debt paying a guaranteed high coupon. Actual waterfalls also allocate fees, interest and principal separately, and performance triggers can redirect cash away from junior investors before final principal losses occur.
Before the global financial crisis, one attraction of tranching was the ability to create a large highly rated senior layer from assets of more moderate individual credit quality, alongside small riskier layers. Demand from institutions seeking highly rated securities helped support this market. The rating depended on subordination and model assumptions about the pool; it did not turn the underlying borrowers into safer borrowers. Errors about common shocks or recoveries could therefore undermine even a thick senior tranche.
Let be the initial pool principal, cumulative losses as a fraction of that principal, and and the tranche’s attachment and detachment points. The tranche has principal . Its loss amount and loss fraction are:
Attachment is the loss buffer beneath the tranche; detachment is the loss level exhausting it. All three percentages must use the same pool denominator. In a pool of 100 with equity of 3, mezzanine of 7 and senior claims of 90, the attachment/detachment pairs are 0%/3%, 3%/10% and 10%/100%. If loans of 10 default with loss given default of 40%, the pool loses 4, not 10. Equity loses its entire 3; mezzanine loses 1, or ; senior loses nothing. The pool’s surviving principal is 96 and the surviving tranche principals sum to the same 96.
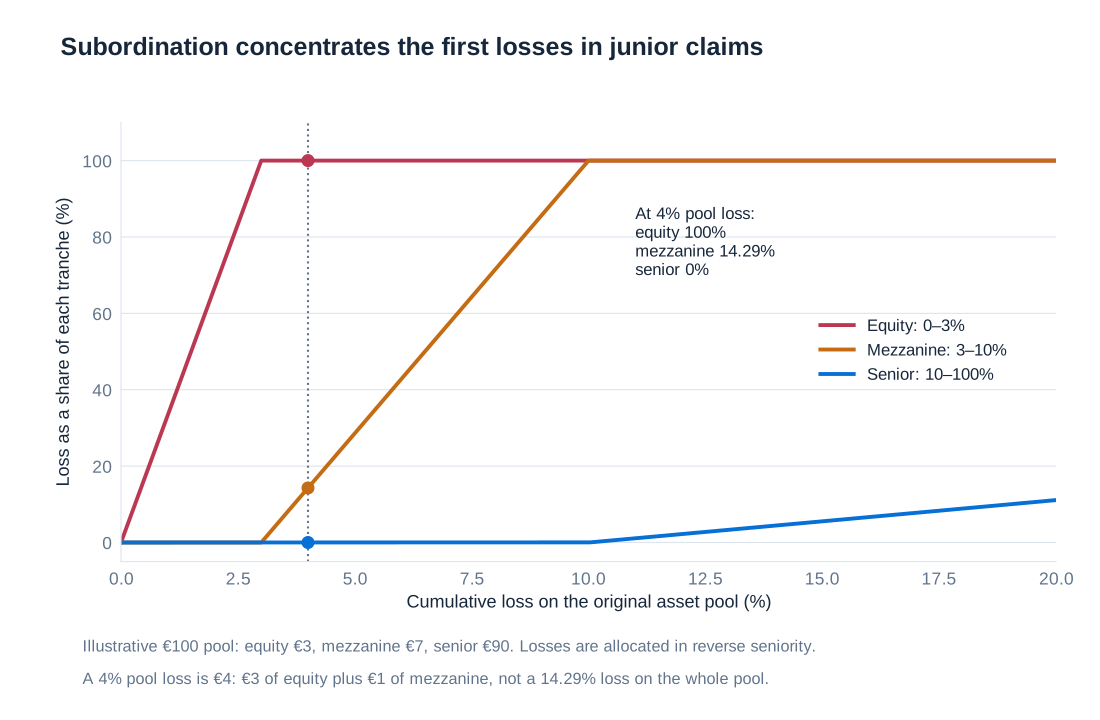
A second worked example uses a EUR 100 million pool with a 0–5% equity tranche, a 5–15% mezzanine tranche and an 85% senior tranche. With a 9% pool loss, mezzanine loses 4% of pool principal, which is 40% of its own principal. With EUR 12 million of losses, equity absorbs 5 and mezzanine 7; the mezzanine loss rate is 70%. With EUR 18 million of losses, both junior layers are exhausted and senior loses EUR 3 million, or . These calculations use different tranche boundaries from the preceding example and must not be mixed.
| Pool loss | Equity loss | Mezzanine loss | Senior loss | Mezzanine principal lost |
|---|---|---|---|---|
| 3 | 3 | 0 | 0 | 0% |
| 9 | 5 | 4 | 0 | 40% |
| 12 | 5 | 7 | 0 | 70% |
| 15 | 5 | 10 | 0 | 100% |
| 18 | 5 | 10 | 3 | 100% |
| 20 | 5 | 10 | 5 | 100% |
A complete two-loan securitisation calculation
Consider two one-year loans of EUR 100 each, both with zero contractual interest. Loan 1 has default probability 5%, loan 2 has default probability 10%, and recovery in default is 50% for each. Defaults are independent. Consequently, each loan pays either EUR 100 or EUR 50, and the pool pays EUR 200, EUR 150 or EUR 100. The probabilities multiply because independence is an explicit assumption; mere similarity of borrowers would not justify it.
| Outcome | Probability calculation | Probability | Pool payoff | Senior payoff | Equity payoff |
|---|---|---|---|---|---|
| Neither defaults | 85.5% | EUR 200 | EUR 130 | EUR 70 | |
| Only loan 1 defaults | 4.5% | EUR 150 | EUR 130 | EUR 20 | |
| Only loan 2 defaults | 9.5% | EUR 150 | EUR 130 | EUR 20 | |
| Both default | 0.5% | EUR 100 | EUR 100 | EUR 0 |
The senior claim fails to receive its full EUR 130 only when both loans default, so its default probability is 0.5%. Under the deliberately simplified rating mapping below it is classified Baa. The mapping is an illustrative exercise convention, not an agency’s general rating methodology: actual ratings also depend on horizon, instrument structure and other criteria. The quoted rounded intervals leave small gaps; these do not affect a probability of exactly 0.5% and should not be treated as a complete classification algorithm.
| Rating label | Quoted one-year default-probability range |
|---|---|
| Aaa | At most 0.02% |
| Aa | 0.03%–0.10% |
| A | 0.11%–0.24% |
| Baa | 0.25%–0.58% |
| Ba | Above 0.58% |
The pool’s expected loss is euros. Senior expected loss is euros, leaving EUR 7.35 expected loss for equity. Expected payoffs are therefore EUR 129.85 and EUR 62.65, which sum to EUR 192.50. A low probability of senior default should not be confused with no loss severity: conditional on default in this example, senior loses of principal.
Correlation and why expected pool loss is insufficient
Pool valuation depends on tranche boundaries, interest earned on assets, expected losses and the joint distribution of losses. With many independent risks, diversification makes realised average losses concentrate around their expectation. Common exposure to a region, industry or macroeconomic shock can instead produce many simultaneous defaults. The analogy is averaging independent dice rolls versus making every die show the same result: identical individual distributions need not produce the same distribution of the average.
The two-loan example makes this precise. Keep each loan’s default probability and recovery fixed, and write for the probability that both default. The four probabilities become , , and , with . Independence gives ; positive dependence raises it. Expected pool payoff remains EUR 192.50, but senior expected payoff is , and equity expected payoff is . A larger probability of joint default therefore transfers expected payoff from senior to equity in this structure. Equity benefits from more probability of the no-loss outcome while its downside is capped at zero.
This comparison holds marginal default risks fixed. It is not a claim that an economic crisis helps every equity-tranche investor: a crisis may raise default probabilities, lower recoveries, impair liquidity and change discount rates simultaneously. Nor does the direction for mezzanine tranches have to be monotonic. Tranche prices require the full distribution and pricing assumptions; an expected-loss calculation alone is not a market valuation.
Risk transfer, incentives and financial stability
For an originator, securitisation can release funding, diversify credit exposure and allow greater specialisation in origination, credit assessment and servicing. It may reduce interest-rate or liquidity mismatches when long-lived assets are funded by appropriately matched securities. It can also reduce regulatory capital requirements when the applicable risk-transfer conditions are satisfied. These are potential benefits, not automatic consequences: a securitisation vehicle funded by short-term paper can itself perform maturity transformation, and retained guarantees or liquidity lines can send risk back to the bank.
At system level, distributing risks to investors with long horizons and genuine loss-absorbing capacity can improve resilience. Tranching can align claims with different risk tolerances, while diversification reduces individual concentration. Conversely, opaque structures can hide correlated exposures and move losses to leveraged institutions or investors vulnerable to withdrawals. A large number of holders does not imply that each can absorb its allocation. The relevant question is who ultimately bears losses and how that holder is financed.
Adverse selection arises because originators know more about the assets than buyers. Moral hazard arises when the prospect of selling loans weakens screening or servicing effort. Representations, warranties, disclosure, investor due diligence and retained economic exposure address these problems. The EU securitisation framework includes due-diligence obligations and a minimum 5% material net economic interest under specified retention methods. Retention does not guarantee prudent lending, and capital relief is distinct from merely satisfying a retention rule.
The legal consequences can be substantial. In January 2017 the US Department of Justice announced a USD 7.2 billion civil settlement concerning Deutsche Bank’s 2006–07 RMBS: USD 3.1 billion in a civil penalty and USD 4.1 billion in consumer relief. The agreed facts included misleading information about defective loans, diligence decisions influenced by the desire to retain originators’ business, and use of earlier borrower credit scores despite subsequent deterioration. These facts connect the incentive problem directly to disclosure quality. Other large RMBS settlements included approximately USD 5 billion for Goldman Sachs and USD 13 billion for JPMorgan. These amounts are settlement packages, not necessarily entirely cash fines of the same type.
A broader historical estimate reported in 2015 put bank litigation costs around USD 260 billion, with a further USD 65 billion anticipated. Its categories included mortgage mis-selling of USD 110 billion, UK payment-protection insurance of USD 43 billion, foreign-exchange manipulation of USD 15 billion, LIBOR/EURIBOR manipulation of USD 10 billion and money-laundering matters of USD 15 billion. These selected categories do not add to the overall total and are not a current estimate. They illustrate that legal and conduct risks cut across products, creating incentives for investment in controls and compliance.
Legal sources: EU Regulation 2017/2402, particularly due diligence and retention; DOJ’s Deutsche Bank settlement announcement. The broader 2015 litigation estimate is a dated Financial Times compilation, not a harmonised official series.
Acquisition finance: from commitment to permanent funding
An acquisition agreement and its financing operate on different clocks. A bidder may need credible evidence of funds before signing, while regulatory approval and completion remain months away. Issuing all the permanent debt or equity immediately could create unnecessary carrying costs or expose a confidential transaction prematurely. A bridge facility provides committed temporary funding, subject to agreed conditions, until cash, asset disposals, bonds, equity or term loans can replace it. A bridge is not necessarily a revolver: some bridge loans are term facilities with no right to redraw repaid amounts.
Before completion, lenders face commitment, funding-capacity, documentation and syndication risks even when the loan remains undrawn. The central “hung bridge” risk arises if the acquisition closes and the bank must fund just when capital markets no longer support refinancing on the expected terms. The bank may then have to retain a larger or longer exposure than planned. Fees compensate for commitments and arranging work; interest compensates for drawn funds. A failed acquisition can remove the need to draw if contractual conditions prevent utilisation, but the precise consequences depend on the documentation.
Permanent financing should match the combined business’s sustainable cash flows and target capital structure. Expected synergies do not automatically become cash available for debt service at completion. Integration costs, cyclical downturns, legal liabilities, collateral, covenant restrictions and refinancing maturities all affect debt capacity. A transaction can be attractive on a strategic valuation while still having a fragile financing structure.
Bayer–Monsanto: a multistage financing case
The Bayer–Monsanto transaction demonstrates why a bridge commitment and the amount eventually drawn differ. Before the September 2016 agreement, Bayer arranged approximately USD 56.9 billion of bank financing, initially with five banks and subsequently syndicated more widely. The announced all-cash transaction value was approximately USD 66 billion. Completion came on 7 June 2018, after a lengthy antitrust process; Bayer’s reported closing transaction value was approximately USD 63 billion including net debt. These are figures measured at different stages, not amounts to add together.
| Date | Financing or transaction step | Economic role |
|---|---|---|
| September 2016 | Approximately USD 56.9 bn committed bridge financing; merger agreement signed on 14 September | Demonstrates financing capacity before permanent issuance |
| November 2016 | Approximately USD 4.2 bn mandatory convertible notes | Provides funding with subsequent mandatory equity conversion |
| December 2016 | Monsanto shareholders approve the transaction | Advances completion while regulatory review continues |
| June 2017 | EUR 1 bn exchangeable bond, approximately USD 1.2 bn | Raises cash against a security exchangeable into Covestro shares |
| January and May 2018 | Covestro share sales of approximately EUR 1.8 bn and EUR 2.2 bn | Reduces financing required from the bridge |
| April 2018 | EUR 3 bn equity placement to a Singapore investment entity | Funds the acquisition and supports equity capital |
| June 2018 | Rights issue raising approximately EUR 6 bn net | Adds permanent equity funding |
| 7 June 2018 | Acquisition closes; approximately USD 43 bn bridge initially drawn | Pays the required completion funding |
| June 2018 onward | USD 15 bn and EUR 5 bn bond issues, plus cash flow and disposal proceeds | Replaces much of the drawn bridge with longer-term sources |
| 31 December 2018 | USD 4.9 bn acquisition financing still outstanding | Shows that refinancing was substantial but not yet complete |
The interval from signing to completion was approximately 21 months, illustrating the need to manage availability periods and extension terms when approval takes longer than a short initial financing horizon. One should not infer that every bridge automatically matures 12 months after signing: the maturity of a drawn loan and the period during which a commitment can be drawn are separate contractual concepts. The financing sequence combined pre-closing fund raising with post-closing refinancing; an exchangeable bond, a mandatory convertible and an ordinary bond also have different implications for future ownership and repayment.
The annual reports identify commitment and related syndicated-financing fees of EUR 51 million in 2016, EUR 210 million in 2017 and EUR 124 million in 2018, totalling EUR 385 million. This is separate from interest on drawings and from unrelated advisory or integration costs. The case therefore explains why an undrawn commitment can generate significant revenue for lenders and expense for a borrower. It also shows why the full commitment should not be treated as drawn for the entire signing-to-closing period.
Primary financial statements: Bayer’s 2016 annual report, 2017 financial statements and 2018 annual report. The outstanding USD 4.9 billion is the year-end amount in the 2018 financing notes.
Amazon–Whole Foods: pricing the incentive to refinance
Amazon’s June 2017 commitment provided for up to USD 13.7 billion through permanent funding and, to the extent still required, a 364-day senior unsecured bridge term facility. Its pricing varied with both the borrower’s rating and the time elapsed since completion. At the strongest rating category, the LIBOR margin rose from 75 basis points during the first 90-day interval to 150 basis points from day 270. Rising margins encourage timely refinancing after completion, when the temporary facility is no longer needed for transaction certainty.
| Rating level | Days 0–89 | Days 90–179 | Days 180–269 | Day 270 onward | Undrawn fee |
|---|---|---|---|---|---|
| I: A+ / A1 or better | 75 | 100 | 125 | 150 | 5 |
| II: A / A2 | 100 | 125 | 150 | 175 | 7 |
| III: A− / A3 or worse | 100 | 125 | 150 | 175 | 9 |
The table is a historical benchmark-based schedule; it is not a current borrowing quotation. The contract also provided alternative base-rate margins and specified when undrawn fees began. For example, Level I base-rate margins were 0, 0, 25 and 50 basis points over the four intervals; Level II were 0, 0, 50 and 75; Level III were 0, 25, 50 and 75. Differences between benchmark conventions mean these margins cannot be compared without the corresponding base rates. Economically, the time step-up addresses post-contractual incentives to leave a bridge outstanding, whereas rating-based variation prices credit quality.
Primary document: Amazon’s 15 June 2017 commitment letter, Exhibit 10.1, including the pricing grid. The model lesson is that loan pricing can respond to elapsed time as well as borrower risk.