
17. Experimental and Quasi-Experimental Reasoning
Counterfactual identification, LATE, matching and regression discontinuity
A design-based way to think
The central challenge in applied econometrics is not the calculation of a regression coefficient but the construction of a credible comparison. In an ideal randomised controlled trial, assignment to treatment is independent of potential outcomes. In observational studies, researchers seek circumstances in which treatment changes for reasons plausibly unrelated to the unobserved outcome determinants. Identifying such variation may depend on a regulation, an institutional threshold, a natural event or a policy timetable; each source has its own assumptions and threats.
The relevant objects should be named precisely: a sample average treatment effect (SATE) refers to the realised study sample; a population ATE averages across the population; ATT refers to the treated; and IV may identify LATE for compliers. These parameters differ when effects vary with people, treatment intensity or baseline circumstances. Researchers should not treat every estimate as a universal treatment effect.
Randomised experiments and intention to treat
With random assignment Z to a programme, the intention-to-treat effect is the difference in mean outcomes by assignment:
It measures the effect of offering or assigning treatment, regardless of actual take-up, assuming the experiment's integrity and correct outcome measurement. If assignment changes participation D but not everyone complies, the Wald ratio ITT of Y divided by ITT of D can identify LATE under the standard additional assumptions: random assignment, exclusion, relevance and monotonicity. ITT and the effect of receiving treatment answer different questions and should be reported accordingly.
Experiments can be distorted by selective attrition, treatment contamination, spillovers and departures from the assigned protocol. Randomisation addresses baseline confounding in expectation; it does not make badly measured post-treatment outcomes reliable or guarantee that results transport to another country.
Matching, regression adjustment and overlap
If treatment is conditionally independent of potential outcomes given observed pretreatment X and overlap holds, treated and untreated units can be compared within sufficiently similar control strata. Matching methods construct comparisons based on observed characteristics or a propensity score e(X)=P(D=1|X). Regression adjustment models expected outcomes given controls and treatment status. Inverse-probability weighting reweights observations according to treatment propensity.
Matching and regression do not produce causal validity by themselves. Both depend on the claim that the observed controls eliminate selection bias and must be sensitive to lack of overlap, model misspecification and poor measurement. Weighting can become unstable when propensity scores approach zero or one. Before fitting a model, inspect which combinations of covariates appear in both groups and whether the implied counterfactual comparisons are credible.
Regression discontinuity designs
A regression discontinuity (RD) design exploits an assignment rule that changes at a known threshold c of a running variable R. For a sharp RD, treatment changes deterministically at c, so the causal effect at the cutoff is identified as the discontinuity in the conditional expectation:
The crucial assumption is continuity of potential-outcome expectations in the running variable at the threshold in the absence of treatment. Units immediately on either side should be comparable except for treatment. Estimation usually uses local polynomial methods in a neighbourhood of c, bandwidth selection and inference procedures suited to the local design. A global high-order polynomial fit is generally a poor substitute for careful local analysis.
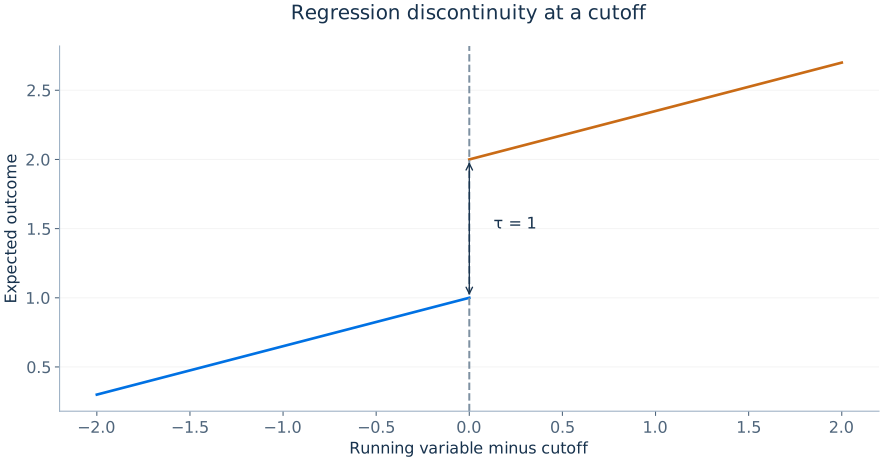
In a fuzzy RD, treatment probability jumps at the cutoff without switching perfectly from zero to one. The jump in outcomes is divided by the corresponding jump in treatment probability, making fuzzy RD a local instrumental-variable design. Manipulation or strategic sorting around the threshold, other concurrent policy cutoffs and discontinuous baseline covariates threaten validity.
Difference-in-differences revisited
A policy adopted in one region but not another may create a natural experiment if untreated potential outcomes follow comparable trends. DID subtracts the comparison region's change from the treated region's change, removing fixed group differences and common time shocks in the basic setup. An event-study model can estimate relative effects before and after treatment, but its interpretation requires appropriate treatment-effect heterogeneity handling and no differential anticipatory responses.
Where treatment adoption varies across periods and groups, ordinary two-way FE can yield misleading weighted averages under heterogeneous effects. Estimators designed to compare newly treated units with appropriate untreated or not-yet-treated controls may provide more transparent targets.
Design diagnostics and honest interpretation
Each identification strategy has a distinct place for empirical diagnostics: balance and attrition in experiments, overlap and covariate balance in matching, pre-policy trend evidence in DID, density and covariate continuity at the RD threshold, and first-stage strength plus exclusion arguments for IV. None of these diagnostics proves every causal assumption; their value is in ruling out particular plausible failures and making the study's limitations transparent.
A useful research report connects: research question → estimand → identifying comparison → estimation method → standard error → economic interpretation → limitations. Sophisticated estimators cannot substitute for this sequence.