
9. Legal Status and Political Representation
Public policy can alter political participation without immediately changing who is legally entitled to vote. Immigration legalization provides a particularly revealing example: removing uncertainty about residence and employment may change household investment, civic engagement and the capacity of an existing community to support political candidates. This chapter examines Bernini and Sabet’s study of the Immigration Reform and Control Act (IRCA). It connects treatment intensity, fixed effects, event studies, instrumental variables and mechanism analysis within one empirical investigation. The outcome called political mobility is advancement between elected offices; it does not mean geographical migration or movement between jobs.
Legalization before widespread enfranchisement
IRCA was enacted in 1986 and enabled nearly three million undocumented immigrants to obtain legal status. Approximately 86 percent of applicants were Hispanic. Permanent residence began to be granted in 1989, while the usual five-year wait before naturalization separated legalization from the acquisition of citizenship and voting rights. The main political analysis therefore concentrates on 1984–1994. This timing creates a useful distinction between the consequences of more secure legal status and those of directly adding newly naturalized voters to the electorate.
People lacking legal status were already residents and were included in population statistics. Legalization therefore changed the legal composition of the existing population rather than mechanically adding the same number of new residents. This is an institutional argument, not a guarantee that migration or other demographic responses were absent. Those responses must be examined empirically. Nor does the timing imply that every political change before 1995 was entirely free of naturalization: the defensible claim concerns the period before widespread naturalization of IRCA beneficiaries.
The political mechanism is broader than recipients casting ballots. Security against removal and permanent access to employment may encourage educational investment, make families more willing to contact public institutions, and strengthen organizations serving mixed-status households. Relatives and other community members who already hold voting rights can respond. An increase in Hispanic officeholders is consequently compatible with most newly legalized residents remaining ineligible to vote during the main observation window.
Measuring exposure and matching the unit of analysis to the question
The treatment is a continuous county-level measure. The researchers count IRCA applicants relative to the county population in 1980, multiply by 1,000, and standardize the resulting variable. A one-unit change in the standardized measure means one standard deviation of exposure across counties. It does not mean one additional applicant, one percentage point of the population, or that every resident receives treatment.
Writing the unstandardized exposure as and its standardized form as makes the units explicit:
Administrative records contain 3,039,239 applicants, of whom 2,744,173 have county identifiers. The remaining 295,066 retain state identifiers, but their county information is suppressed. Allocating these observations across counties introduces a measurement issue rather than merely a data-cleaning inconvenience: different allocation rules can change the intensity measure. The study therefore repeats the analysis with alternative imputation procedures, denominators and predictions.
Political representation comes from a newly assembled longitudinal database of Hispanic elected officials. For aggregate representation, the unit is an office category within a county and year. For career progression, it is an individual official and year. School enrollment, teacher employment, political participation and fiscal outcomes draw on additional administrative and survey sources. These datasets answer different questions and need not contain the same observations. A larger number of individual records does not create an equally large number of independent treatment assignments because exposure varies at county level.
A continuous-treatment difference-in-differences design
The baseline specification compares changes in outcomes between places with different IRCA exposure, before and after permanent residence began to be granted:
Here denotes the observation unit, its county and its state. The unit fixed effect absorbs stable differences between counties, schools or politicians, depending on the outcome. State-by-year effects absorb shocks shared within a state in a particular year. Baseline county characteristics , interacted with the post-treatment indicator, allow the post-period change to differ with pre-existing demographic and economic conditions. Standard errors are clustered by county because both the exposure and plausible unobserved shocks are shared within counties.
The identifying condition is a conditional parallel-trends assumption: absent legalization, outcome changes would not have varied systematically with baseline IRCA intensity after accounting for the included controls and fixed effects. The comparison is between more- and less-exposed places, not between randomized recipients and nonrecipients. The coefficient describes the differential outcome change associated with one standard deviation of county exposure under this model. Interpreting it as the individual effect of granting one person legal status would change both the estimand and the unit of treatment.
An event study replaces the single post interaction with year-specific exposure interactions and omits 1988 as the reference year. Its coefficients measure differences relative to that baseline. For outcomes available only at long intervals, a long-difference regression relates the change in the outcome to exposure, baseline controls and state fixed effects. These alternatives retain the central comparison while adapting it to the observation frequency.
What the representation estimates actually measure
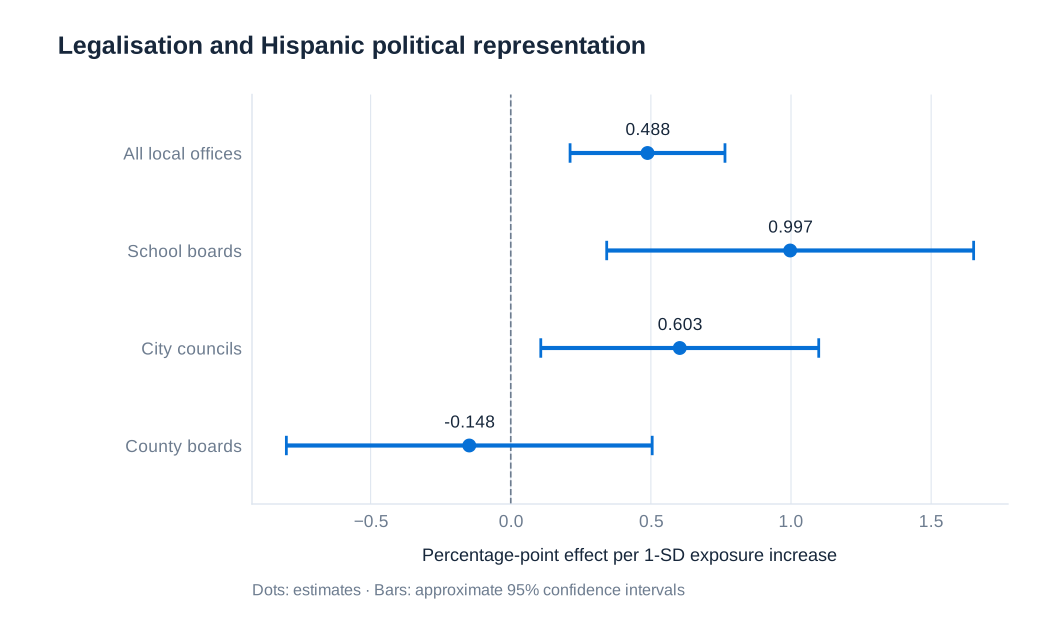
The representation outcome divides the number of Hispanic officeholders by the total number of seats in the same office category and county measured in 1987. Keeping this denominator fixed helps separate changes in Hispanic representation from changes in the number of available offices. The following results use the July 2026 research paper consistently. Effects and standard errors are in percentage points for a one-standard-deviation increase in county exposure; the baseline means are percentages.
| Office category | Effect, percentage points | County-clustered standard error | Pre-1989 mean, percent |
|---|---|---|---|
| All local elected offices | 0.488 | 0.141 | 1.226 |
| All local governing boards | 0.613 | 0.211 | 1.418 |
| School boards | 0.997 | 0.334 | 1.488 |
| All city offices | 0.737 | 0.263 | 1.350 |
| City governing boards | 0.603 | 0.253 | 1.335 |
| All county offices | 0.000 | 0.141 | 0.876 |
| County governing boards | −0.148 | 0.333 | 1.479 |
The school-board coefficient is approximately one percentage point. Relative to the baseline mean, . The corresponding city-board calculation is . Neither number means that representation rose by 67 or 45 percentage points. The county-level estimates are too imprecise to establish comparable gains. The pattern suggests expansion at school and city institutions, where entry points into elected office are more numerous.
The event-study estimates strengthen the timing argument. The pre-1989 coefficients are jointly indistinguishable from zero, while representation increases gradually after legalization: approximately 0.4 percentage points by 1990, 0.8 by 1992, and 1.3–1.4 by 1994 for the combined school-and-city-board outcome. These dynamic estimates concern a combined outcome and should not be substituted for the separate school-board coefficient in the table. Gradual increases across election cycles are consistent with political incorporation rather than an immediate relabeling of existing officials. A pre-trend test cannot prove that the unobserved counterfactual would have remained parallel.
Following the same politician over time
Aggregate gains could reflect more entrants into office, advancement of existing politicians, or both. To study careers, the researchers follow Hispanic officials and code whether they move between government levels from one year to the next. The dependent variable equals 100 for a transition and zero otherwise, so regression coefficients directly express percentage-point changes in transition probabilities. Individual fixed effects remove stable differences in ambition or ability, but they do not absorb time-varying opportunities or shocks.
| Outcome | Effect, percentage points | Clustered standard error | Baseline probability, percent |
|---|---|---|---|
| Any upward move, all offices | 0.280 | 0.117 | 0.804 |
| Any downward move, all offices | −0.011 | 0.053 | 0.687 |
| Upward move among governing boards | 0.426 | 0.096 | 0.557 |
| School board to city board | 0.317 | 0.135 | 0.582 |
| City board to county board | 0.066 | 0.035 | 0.129 |
For upward moves among governing boards, the relative increase computed from the reported entries is . The absolute increase remains 0.426 percentage points: a large relative change can arise from a small initial probability. For all offices, the analogous calculation is about 34.8 percent. Using the displayed table entries avoids misleading percentages obtained by dividing heavily rounded numbers.
The clearest advancement occurs from school boards to city boards. The smaller city-to-county estimate has weaker precision, and the data do not establish a general expansion of jumps to state or federal office. There is also no clear increase in downward mobility. Together, these results support an interpretation of upward progression through nearby institutional levels, rather than indiscriminate turnover across the political hierarchy.
Historical settlement as an instrument
County exposure may remain correlated with unobserved local conditions. The instrumental-variable strategy uses the 1970 share of agricultural workers who were Hispanic, interacted with the post-1989 indicator, to predict exposure. Historical agricultural settlement and migrant networks help explain why some counties later had more eligible applicants. IRCA’s agricultural-worker provision makes this connection particularly relevant.
The first stage predicts the endogenous exposure interaction from the historical settlement interaction and the same exogenous covariates and fixed effects. The second stage replaces the exposure interaction with its fitted component. Two-stage least squares uses only variation in exposure associated with the instrument. In the baseline representation specification, the reported second-stage estimate is 1.369 percentage points, with a clustered standard error of 0.336, and the first-stage Kleibergen–Paap Wald statistic is 219. For upward mobility, the corresponding estimate is 0.913, its standard error is 0.222, and the first-stage statistic is 40. Instrument strength therefore differs between outcomes and samples.
Relevance is not the same as validity. The exclusion restriction requires historical agricultural settlement to affect later changes in representation through IRCA exposure rather than another omitted channel. An instrument measured many years earlier can still be invalid if it predicts persistent civic organization, agricultural transformation or changing rural political opportunities. The study probes these channels using earlier Hispanic civic organizations, crop composition, rural population shares and citizenship composition. Stability after adding these controls is useful evidence, but cannot logically eliminate every alternative mechanism.
The larger instrumental-variable estimates are consistent with attenuation from measurement error in county exposure. They could also reflect different weighting of heterogeneous responses or a failure of the exclusion restriction. A careful interpretation acknowledges these alternatives rather than treating the difference between OLS and IV as proof that measurement error is the sole explanation.
Community empowerment and competing explanations
Mechanism analysis asks whether the intermediate outcomes fit a coherent account. School enrollment rises in more exposed counties, especially among Hispanic students and at secondary-school ages. Individual data suggest that attendance gains are concentrated among foreign-born Hispanic youth, while improvements in completion also reach native-born Hispanic youth. This combination fits both direct responses to legal security and spillovers within households or communities.
The teaching workforce changes in composition rather than clearly expanding in total size. The estimated Hispanic teacher share rises by 0.665 percentage points, with a standard error of 0.211, while the white share falls by 0.753 points. Among female teachers, the Hispanic share rises by 0.935 points. These results concern defined teacher-share outcomes; they should not be described as the same number of percentage points of all county employment. The concentration within locally governed education is consistent with a local institutional channel.
Electoral records, voter registration, participation surveys and newspaper coverage provide complementary evidence of increased political engagement. For example, survey responses from people born in the United States to foreign-born parents indicate greater involvement in influencing others to vote and in campaign activities. Such respondents are not identical to IRCA recipients, and family background is an imperfect proxy for a mixed-status household. Their responses nevertheless help explain how legalization could have political effects before most beneficiaries themselves gained voting rights.
The study also investigates opposing responses. In California, exposure does not predict a statistically detectable rise in support for Proposition 187 or for Governor Pete Wilson, and related analyses examine neighboring counties and survey attitudes. The appropriate conclusion is that these tests do not reveal systematic counter-mobilization in the outcomes and samples studied. It would be stronger than the evidence to conclude that no individual experienced hostility or that every form of backlash was absent.
From representation to school-district policy
A change in descriptive representation need not imply a change in policy. School-district finances provide a way to test whether spending priorities move with legalization exposure. The study relates changes between 1987 and 1997 to county exposure. The table below concentrates on shares with clear and comparable units; total expenditure and revenue are analyzed separately in logarithmic changes.
| Budget share | Effect, percentage points | Clustered standard error | 1987 mean, percent |
|---|---|---|---|
| Current expenditure | −0.644 | 0.205 | 92.835 |
| Current wages | −0.514 | 0.177 | 60.064 |
| Capital expenditure | 0.644 | 0.205 | 7.165 |
| Construction expenditure | 0.609 | 0.212 | 4.305 |
| Tax revenue | −0.409 | 0.178 | 33.162 |
| Intergovernmental transfers | 0.296 | 0.185 | 59.649 |
The construction coefficient corresponds to an approximately 14.1 percent increase relative to its initial share, while the tax-revenue coefficient represents about a 1.23 percent decline relative to its initial share. Current and capital spending shares move in opposite directions because they partition total spending. The positive transfer coefficient is less precisely estimated than the tax-share decline; it should not be presented as an equally certain increase. Total budgets show no statistically detectable overall change.
California ballot-measure evidence shows greater use of proposed general-obligation bonds and less use of proposed property-tax increases. Bonds are borrowing instruments; they are not the same accounting category as intergovernmental transfers. These observations suggest a shift toward capital investment and debt financing, while the nationwide revenue table documents a separate change in revenue composition. The fiscal observation window extends beyond the main pre-naturalization political window, which makes a claim of purely pre-enfranchisement fiscal effects inappropriate. Finally, the evidence is not a separate experiment that randomly assigns Hispanic board membership, so it cannot isolate representation as the only mediator of the fiscal response.
Robustness, interpretation and research source
The study examines alternative exposure constructions, exclusion of California, coverage under voting-rights legislation, balanced samples, influential counties and officials, alternative controls, nonlinear exposure effects, tail trimming, alternative reference years and spatially correlated errors. These checks address different risks. For example, leaving out one county tests whether a single influential place drives the estimate; spatial inference addresses dependence across nearby counties; alternative imputation checks whether suppressed applicant locations determine the result. Passing one of these exercises does not substitute for the others.
The investigation illustrates how a causal argument accumulates across design, timing, data definitions and competing explanations. The strongest conclusion concerns local political incorporation associated with a specific historical legalization program, conditional on the identifying assumptions. Extrapolation to a different legal regime, temporary protection, a different migrant population or a new migration inflow requires additional reasoning. For a reader evaluating any empirical policy paper, the essential questions remain: what variation identifies the effect, what population does it describe, what are its units, and which assumptions could fail?
Research source: Andrea Bernini and Navid Sabet (July 2026), Legal Status and Local Political Power: Evidence from the Immigration Reform and Control Act. Representation results use Table 2; political mobility uses Table 3; instrumental-variable results use Table 4; teacher outcomes use Table 6; public-finance results use Table 8. Relative changes in this chapter are calculated from the reported coefficients and baseline means.