
3. Measuring business cycles: empirical regularities
Introduction
Before asking whether a model explains recessions and expansions, we must decide what counts as a cyclical deviation in the data. Raw output levels mix long-run growth with shorter-run fluctuations. Trend extraction is therefore a substantive modelling and measurement choice, not a cosmetic correction.
The empirical analysis uses linear trends, Hodrick–Prescott filtering and band-pass/high-pass ideas, and shows the transformation of consumption, investment, government expenditure and international flows across different economies. A model should be evaluated using compatible definitions, frequencies, seasonal adjustments and filtering rules.
Two sets of moments matter. Kaldor's facts characterize balanced growth over long horizons: labor productivity and capital per worker tend to grow, while the return to capital, the capital–output ratio and factor income shares are comparatively stable. Business-cycle moments characterize volatility, comovement and timing: investment is typically far more volatile than output, while consumption fluctuates less and several aggregates move procyclically.
Integrated theoretical explanation
Observed macroeconomic series combine several time scales. Long-run growth reflects changes in technology, labor and capital; the medium-run component contains recurring expansions and contractions; and very short-run variation can be seasonal or irregular. These are analytic distinctions, not three separately observable objects. An increase in real GDP from one quarter to the next may occur even when output is below its estimated trend, because positive growth and a negative output gap are different statements. Measuring the business cycle therefore requires an explicit choice about the underlying series and the meaning of its trend.
The contrast between nominal output and real output is fundamental. A nominal expenditure series can increase because of higher prices, greater quantities or both; a real series aims to remove the price-level component. Per-capita or per-worker measures answer still different questions, because they adjust for changes in population or labor input. Taking logarithms can make trends more comparable across time and allows log deviations to be interpreted approximately as proportional departures. Before computing a standard deviation or correlation, the sample period, deflator, treatment of seasonality, transformation and measurement units should all be consistent across series.
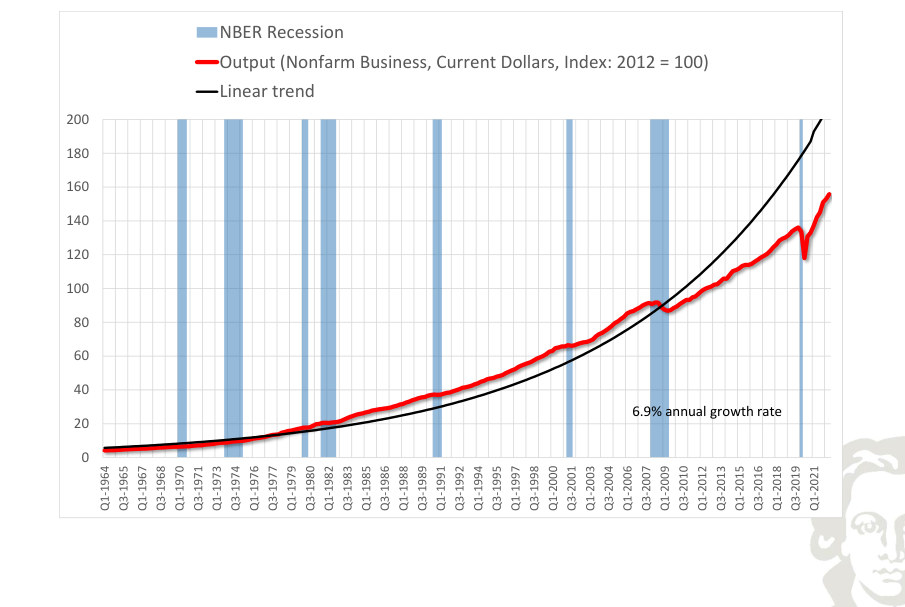
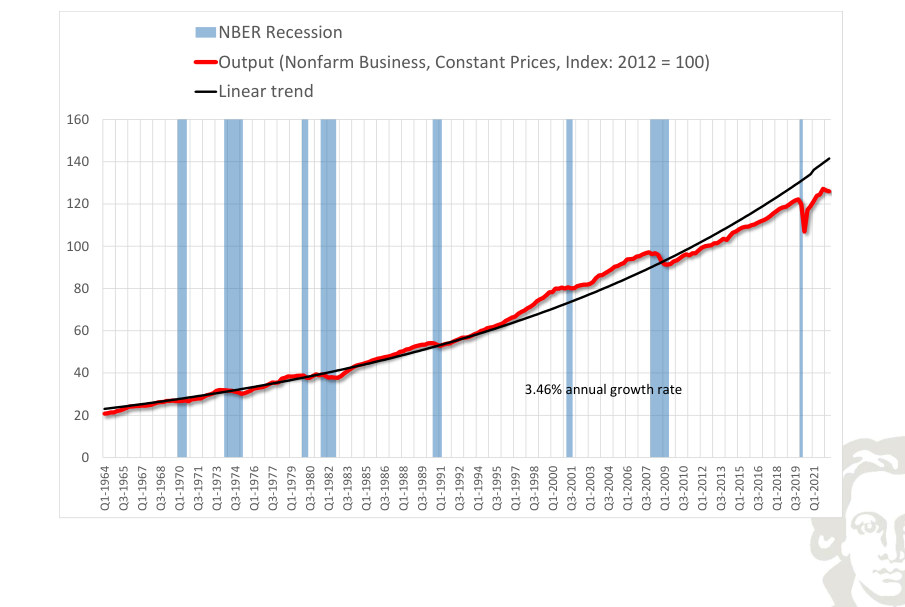
A deterministic linear trend in log output describes a constant average proportional growth rate. Subtracting it yields an output cycle measured relative to this preselected path. Its simplicity is an advantage, but the method is potentially misleading if trend growth changes over time. Conversely, allowing the trend to move too easily can remove genuine cyclical variation. A mechanical trend estimate is consequently not a neutral fact about the data: it embodies a view about which movements are persistent enough to count as growth rather than business cycles.
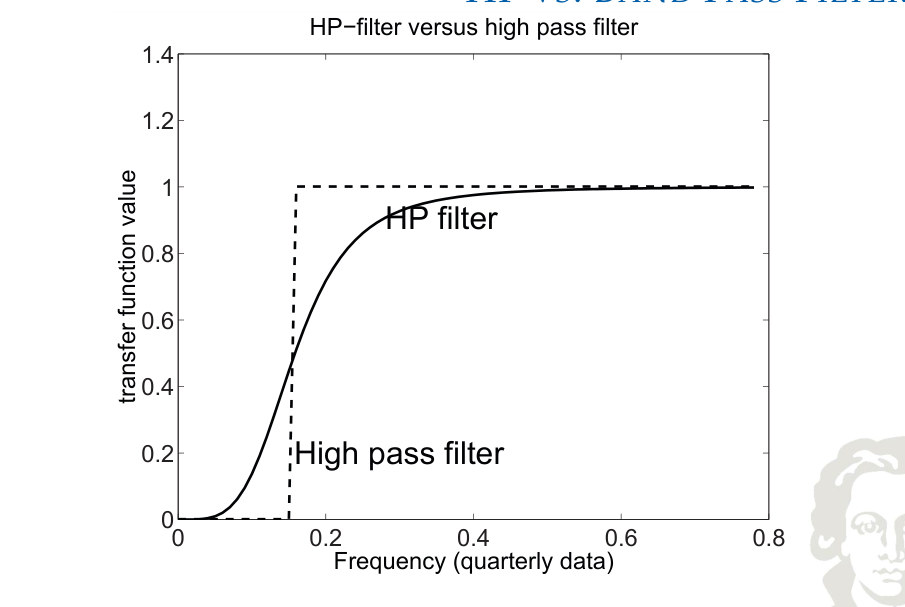
The Hodrick–Prescott filter chooses a smooth trend by minimizing the sum of squared deviations from the observations plus a penalty on variation in the trend's slope. A higher smoothing parameter makes the estimated trend less flexible. The cycle is the difference between the original series and this trend. The procedure is convenient because it produces an operational definition without specifying a full structural model, but it is sensitive to the smoothing choice and to the sample end points. Since the current end of a time series has no future observations available to anchor its trend, revisions can be especially large there.
Band-pass filters address frequency ranges more explicitly. Rather than isolating all residual variation after a smooth trend is removed, a band-pass approach attempts to retain fluctuations with durations within a prescribed interval. This emphasizes that the business cycle is partly defined by periodicity. Filters need not give identical turning points or amplitudes, even when applied to the same national-accounts data. Empirical model comparisons are strongest when the simulated and observed series are subjected to the same transformation instead of comparing unfiltered model deviations with filtered data.
The long-run stylized facts associated with Nicholas Kaldor describe the broad shape of economic growth. Output per worker and capital per worker tend to rise over time, while the capital–output ratio, the rate of return on capital and labor and capital income shares are comparatively stable in a balanced-growth characterization. The Solow model with suitable production technology can reconcile these facts: labor-augmenting technical progress raises productivity, while capital deepening keeps the ratio of capital to effective labor near its stationary value. These properties concern a long-horizon trend and should not be confused with the amplitude of quarterly cyclical fluctuations.
Business-cycle moments instead describe how variables move around their trends. Standard deviation measures typical cyclical dispersion; relative standard deviation divides this measure by that of output. A positive contemporaneous correlation with output indicates procyclical comovement, while a negative one indicates countercyclical movement. Lead–lag correlations examine the timing of a variable's fluctuations relative to output. The broad empirical pattern motivating the RBC benchmark is that consumption is relatively smooth, investment is considerably more volatile than output, and hours worked and many private spending aggregates are procyclical. Capital stock itself usually adjusts much more gradually than gross investment.
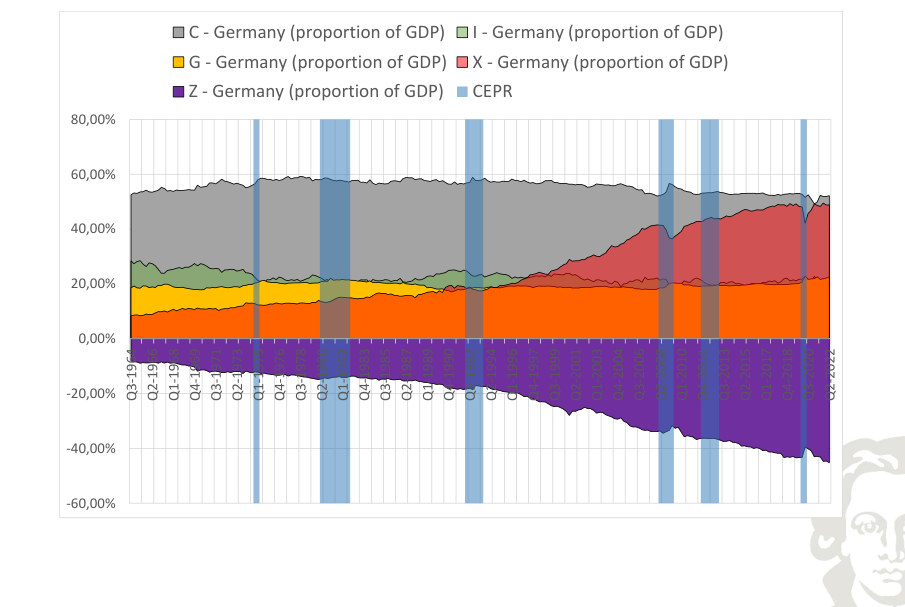
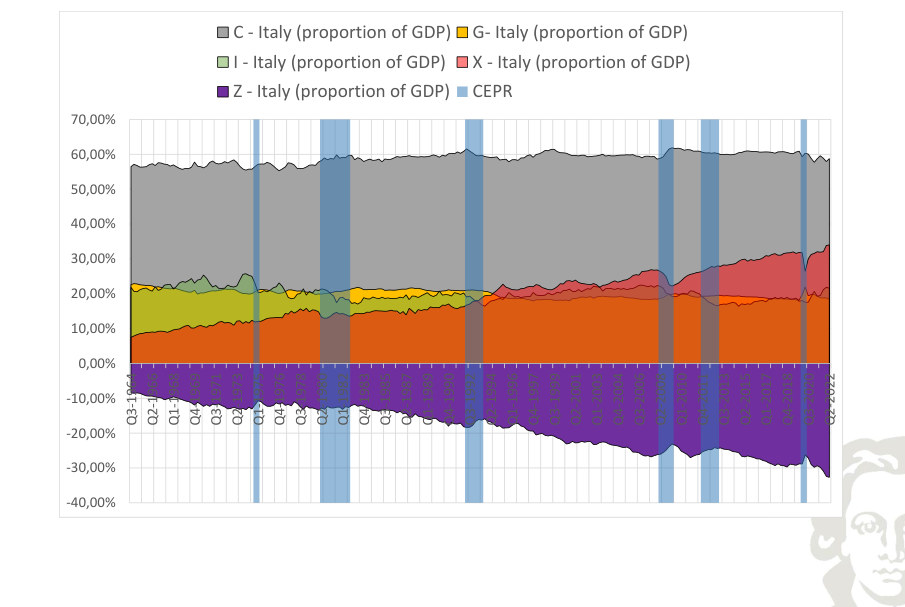
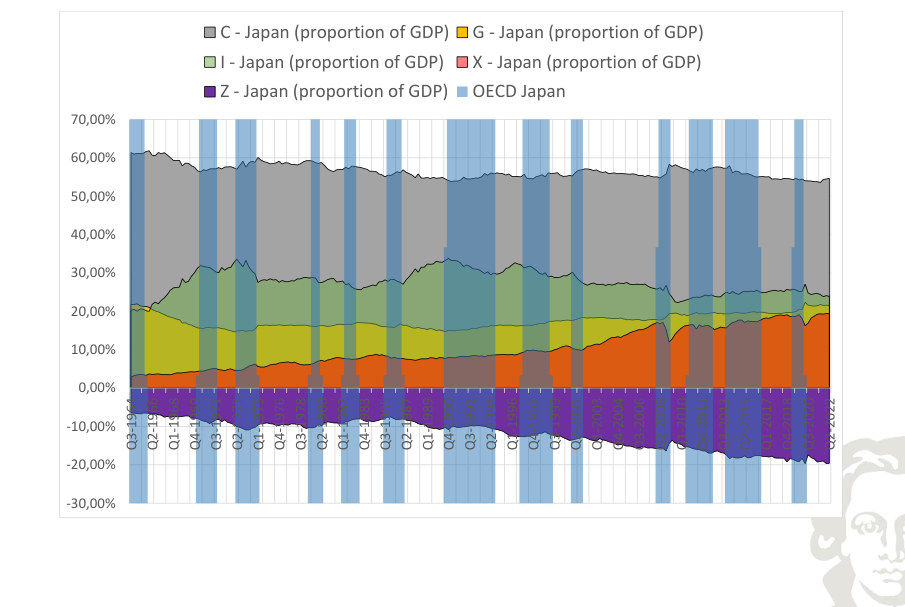
The country and component comparisons matter because no single historical plot can establish a universal regularity. A recession can be global or concentrated in one economy; import and export series reflect external demand and national-accounting differences; and public expenditure need not follow the same cyclical pattern as private investment. When looking at output, consumption, investment, public demand or external flows across different geographic samples, the purpose is to determine which properties are sufficiently persistent to serve as meaningful quantitative targets. The RBC model should be judged on a defined collection of moments, not on whether one chart happens to look similar.
Formal framework and essential relationships
Three concepts of cyclical data
On the log scale, a deviation can be read approximately as a percentage above or below trend. Trends and cycles are measured constructs, not directly observed separate quantities.
The Hodrick–Prescott filter selects the trend τ to trade off fidelity to the observed series against smoothness of its growth. The parameter λ penalizes changes in the trend slope.
Kaldor facts and cyclical moments must not be confused
| Object | Long-run / business-cycle role | Relevant measure |
|---|---|---|
| Output per worker | Growth regularity | Y/L |
| Capital intensity | Growth regularity | K/L |
| Factor income shares | Growth regularity | wL/Y and rK/Y |
| Relative volatility | Business-cycle dispersion | sd(xᶜ)/sd(Yᶜ) |
| Contemporaneous correlation | Business-cycle comovement | corr(xᶜ,Yᶜ) |
| Lead–lag correlation | Timing | corr(xₜ₊ⱼᶜ,Yₜᶜ) |
Empirical business-cycle moments
| Series | Standard deviation | Relative to GDP |
|---|---|---|
| GDP | 0.016 | 1.0 |
| Non-durable consumption | 0.014 | 0.906 |
| Investment | 0.064 | 4.134 |
| Capital | 0.007 | 0.446 |
| Total hours | 0.02 | 1.315 |
| Employment | 0.014 | 0.879 |
| Average hours | 0.009 | 0.592 |
| Labor productivity | 0.01 | 0.644 |
| TFP | 0.012 | 0.774 |
These empirical moments refer to the defined series and detrending transformations. The quantitative model should be evaluated using moments computed on the same basis.
Explanations, derivations and empirical applications
What Are Business Cycles?
Business-cycle statistics summarize recurring comovement and variability in macroeconomic data. Results depend on how the raw series are transformed and which frequency range is taken to represent the cycle.
Business cycles are broad fluctuations in aggregate economic activity rather than movements in a single sector. The classic characterization of Burns and Mitchell distinguishes expansions spread across many activities from similarly widespread contractions, revivals and subsequent expansions. Their duration is not fixed: historical cycles have varied considerably in length. Their defining characteristics include comovement, persistence and a recognizable sequence of phases.
Why The Cycle?
Studying aggregate fluctuations requires tracking many interrelated variables rather than treating output alone as the cycle. Consumption, investment, labor inputs, productivity and other indicators can have different amplitudes and timing. In the spirit of Sims’s argument for confronting macroeconomic theory with reality, statistical models and carefully transformed observations supply a common arena in which competing mechanisms can be quantitatively evaluated.
Decomposing observed macroeconomic data
A common decomposition expresses an observed economic series as a trend component plus a cyclical deviation. The appropriate trend may be suggested by theory, as in the balanced growth path of the neoclassical growth model, but not every variable has a constant trend after simple normalization. Hours per worker, participation and population-related measures may exhibit their own long-run movements. Therefore, the chosen decomposition must be justified separately for the variables being studied.
NBER Recession Output (Nonfarm Business, Current Dollars, Index: 2012 = 100)
Fit to text
Scroll horizontally to inspect the labels and values.
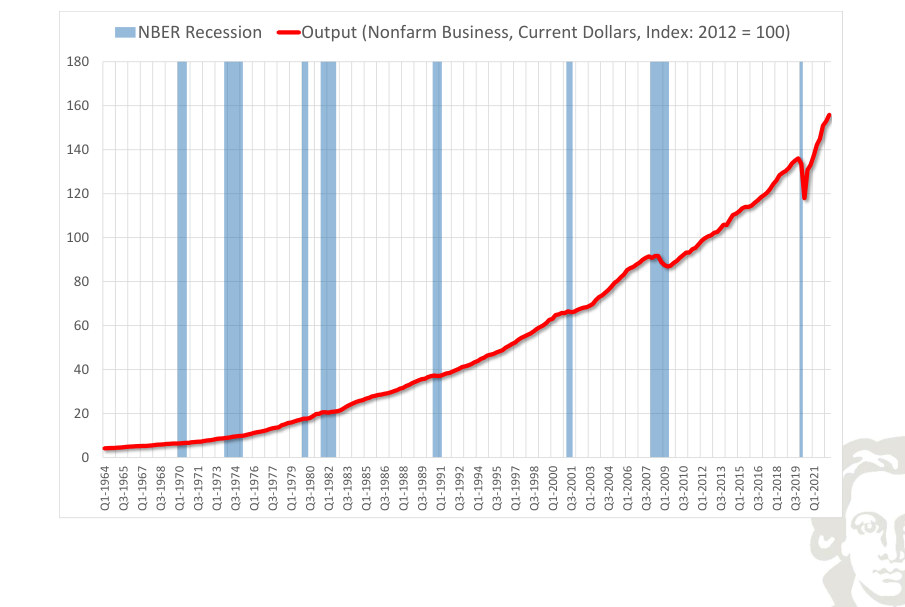
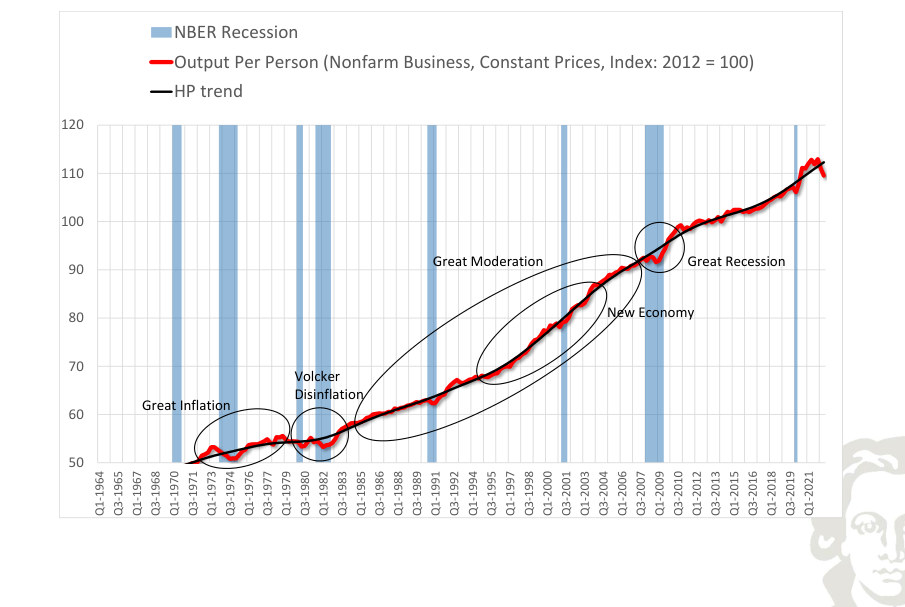
Separating a stochastic cycle from an estimated trend requires selecting an observed series, a trend specification and a smoothing convention. Changes in the trend estimator alter the measured cycle; recession bands provide historical context rather than mechanically defining the cyclical component.
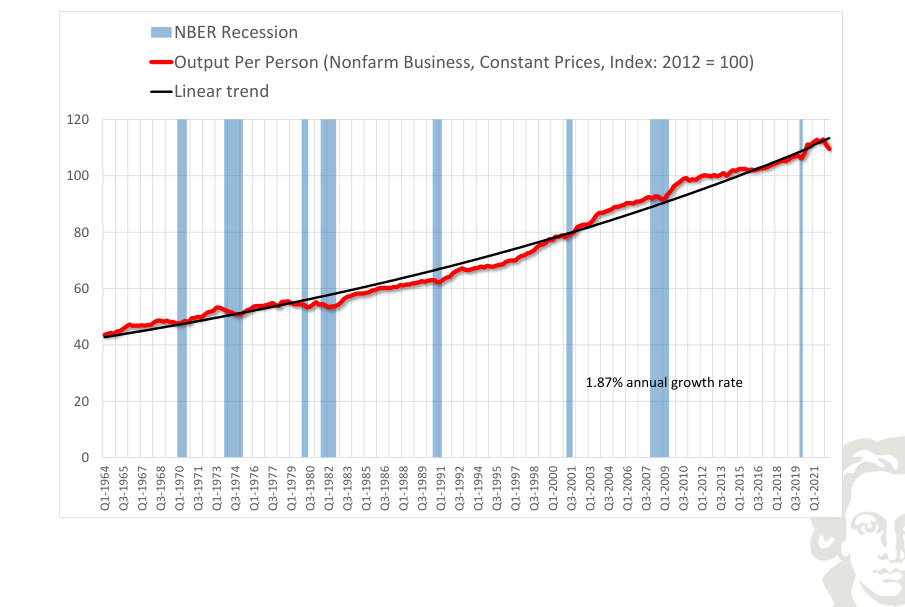
Linear Trend (In Logs)
A linear trend in log output imposes a constant average growth rate. The cyclical component is the difference between observed log output and its estimated trend:
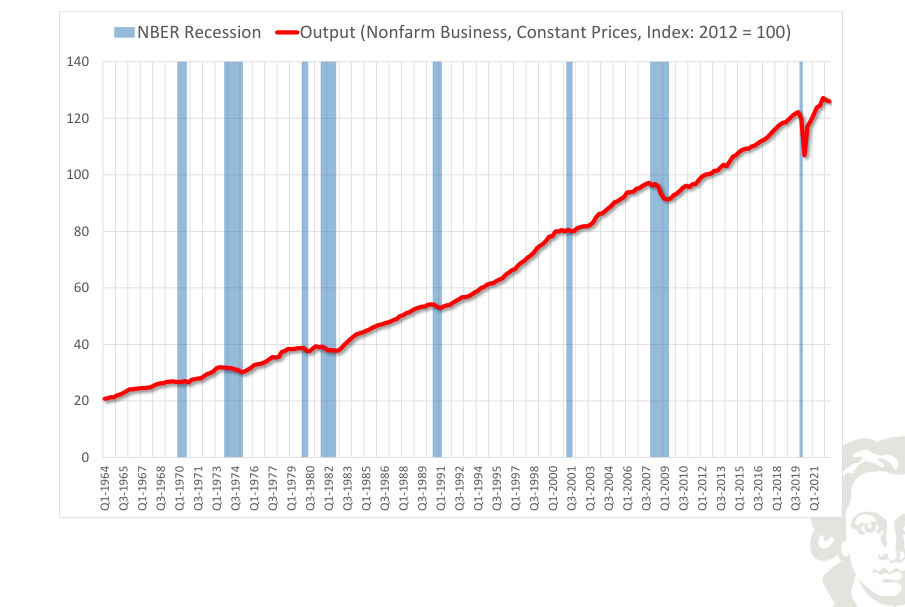
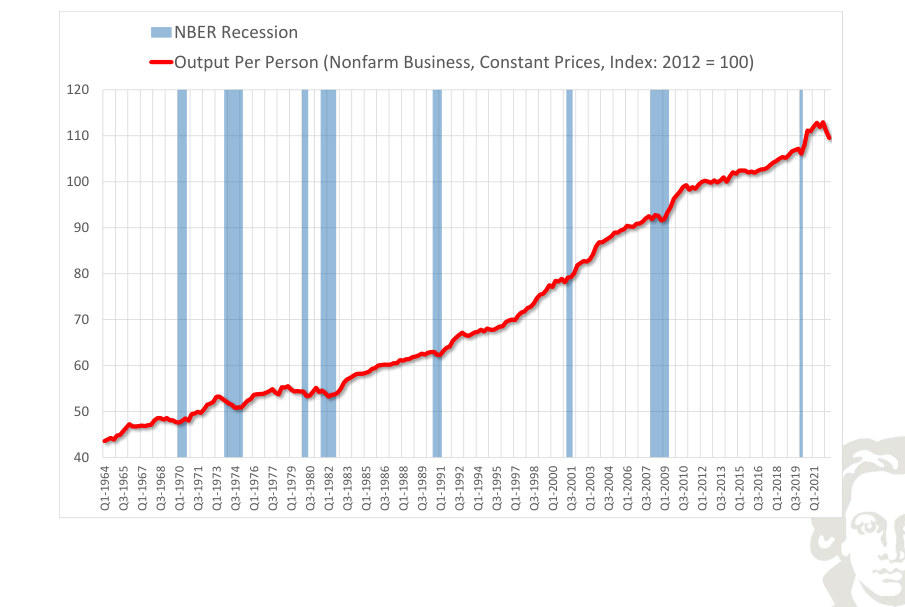
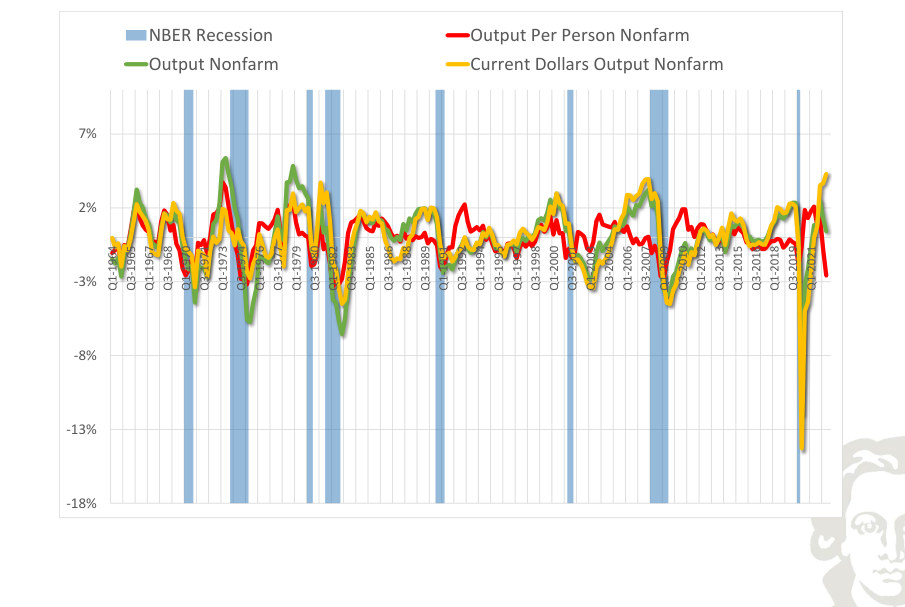
Using real rather than nominal output removes price-level changes, but a fixed trend can still miss changes in growth. Statistical filters allow a time-varying trend.
NBER Recession
Fit to text
Scroll horizontally to inspect the labels and values.
NBER Recession Output (Nonfarm Business, Constant Prices, Index: 2012 = 100)
Fit to text
Scroll horizontally to inspect the labels and values.
NBER Recession
Fit to text
Scroll horizontally to inspect the labels and values.
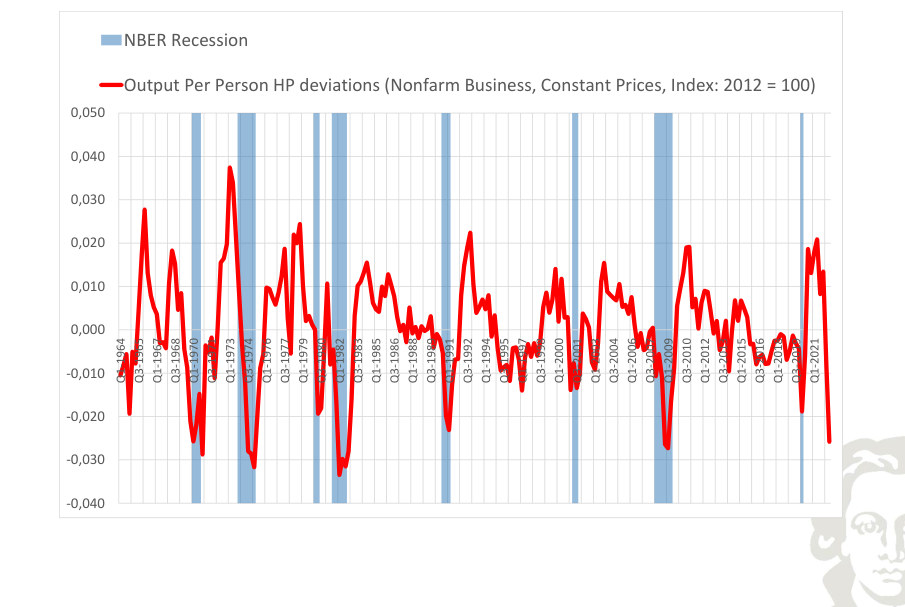
NBER Recession Deviations from trend
Fit to text
Scroll horizontally to inspect the labels and values.
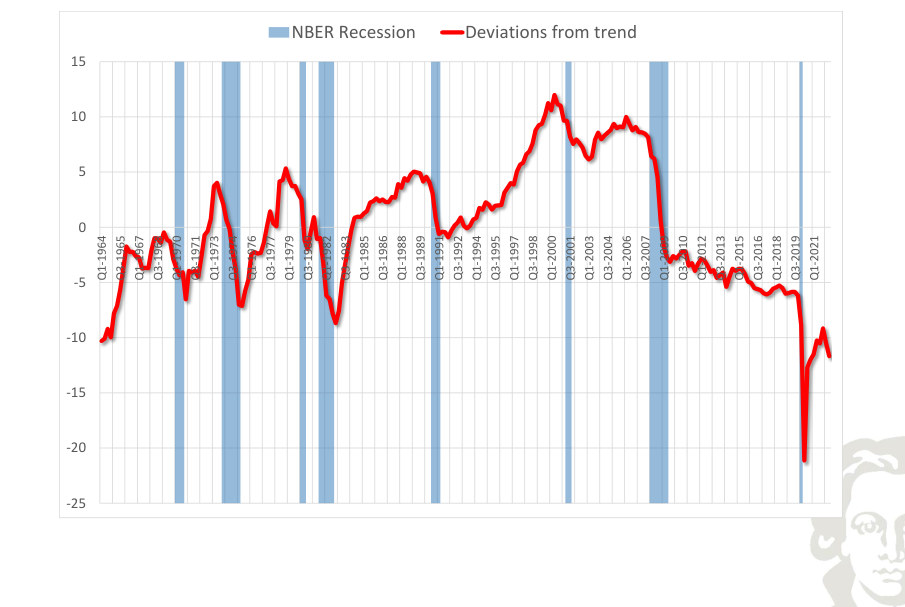
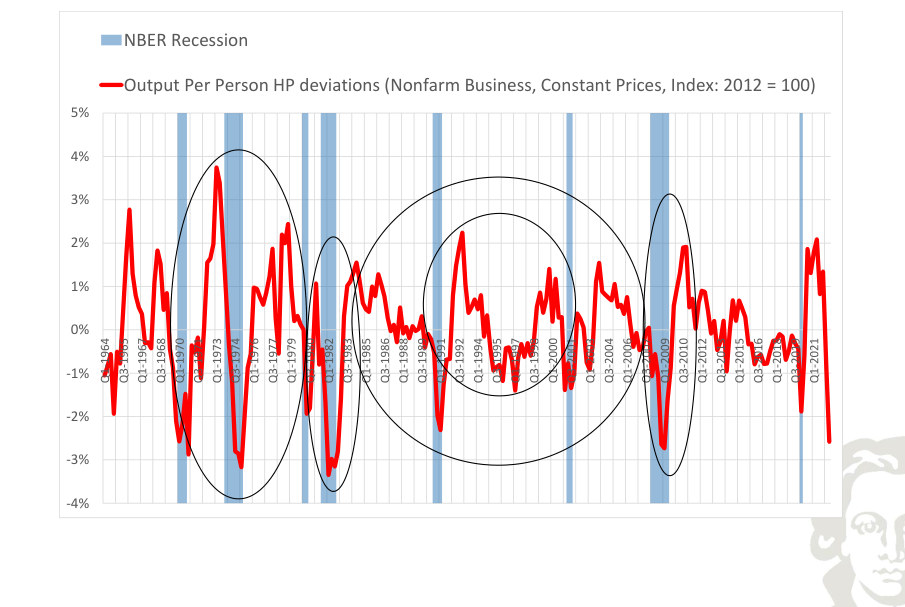
Detrended macroeconomic activity for the selected economy highlights movements above and below the estimated long-run path. The horizontal zero line is a normalization relative to the chosen filter, not a literal condition of zero production. Compare the timing and amplitude of these fluctuations with the corresponding output series.
NBER Recession
Fit to text
Scroll horizontally to inspect the labels and values.
Fit to text
Scroll horizontally to inspect the labels and values.
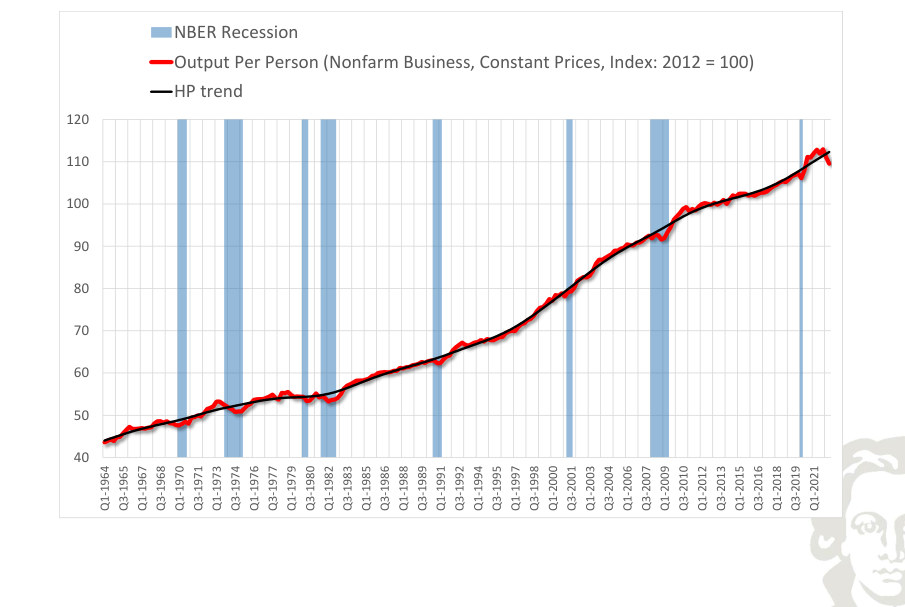
A Statistical Method: Hodrick-Prescott Filter
Separate the observed series into trend and cycle. The HP filter chooses the trend to minimize:
A larger λ penalizes changes in trend growth more heavily. At λ = 0 the trend follows the data exactly; as λ grows without bound, the fitted trend approaches a straight line.
NBER Recession
Fit to text
Scroll horizontally to inspect the labels and values.
Fit to text
Scroll horizontally to inspect the labels and values.
Fit to text
Scroll horizontally to inspect the labels and values.
Fit to text
Scroll horizontally to inspect the labels and values.
NBER Recession Output Per Person Nonfarm
Fit to text
Scroll horizontally to inspect the labels and values.
HP Vs. Band Pass Filter
Fit to text
Scroll horizontally to inspect the labels and values.
Stylized Macro Facts
National expenditure and its transformations:
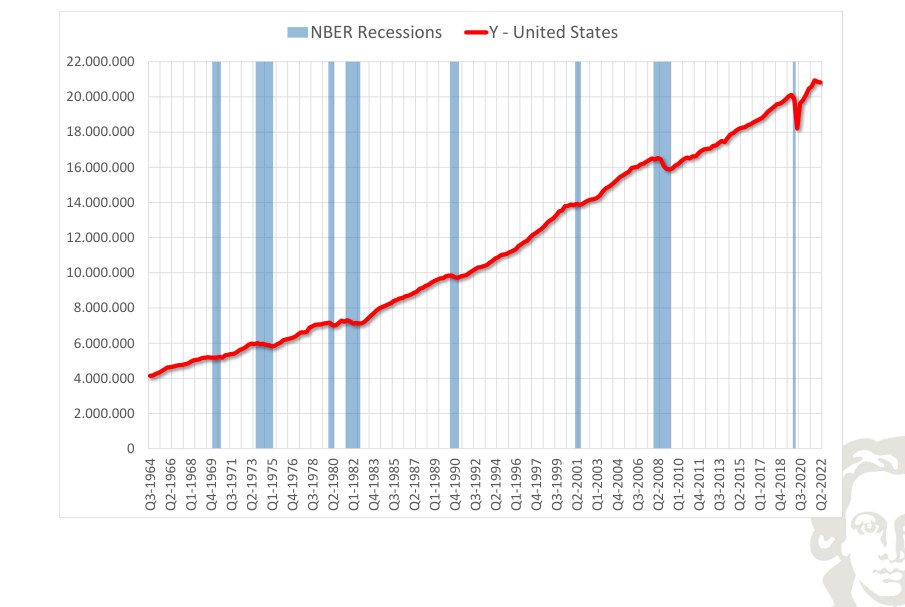
The growth formula compares consecutive observations. The time interval and any annualization must be specified. Source for the country series: OECD.
USA · country series
NBER Recessions Y - United States
Fit to text
Scroll horizontally to inspect the labels and values.
NBER Recessions Y - United States (Annual Growth)
Fit to text
Scroll horizontally to inspect the labels and values.
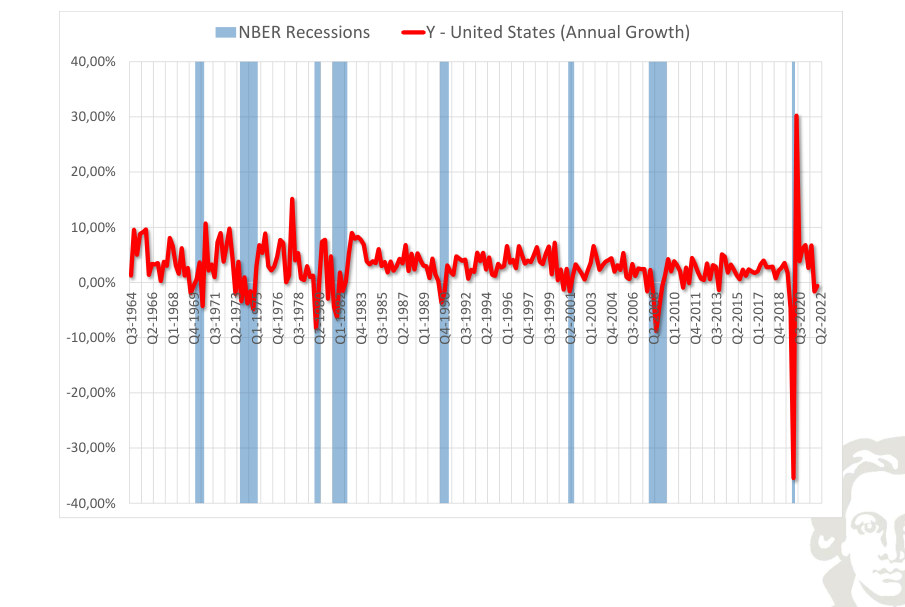
The plotted growth rate of real output for the United States measures the change in activity under the frequency and rate convention of the series. Negative growth and below-trend growth are different concepts; comparing them helps identify contractions without assuming that every slowing constitutes a recession.
NBER Recessions Y - United States (Annual Trend Growth)
Fit to text
Scroll horizontally to inspect the labels and values.
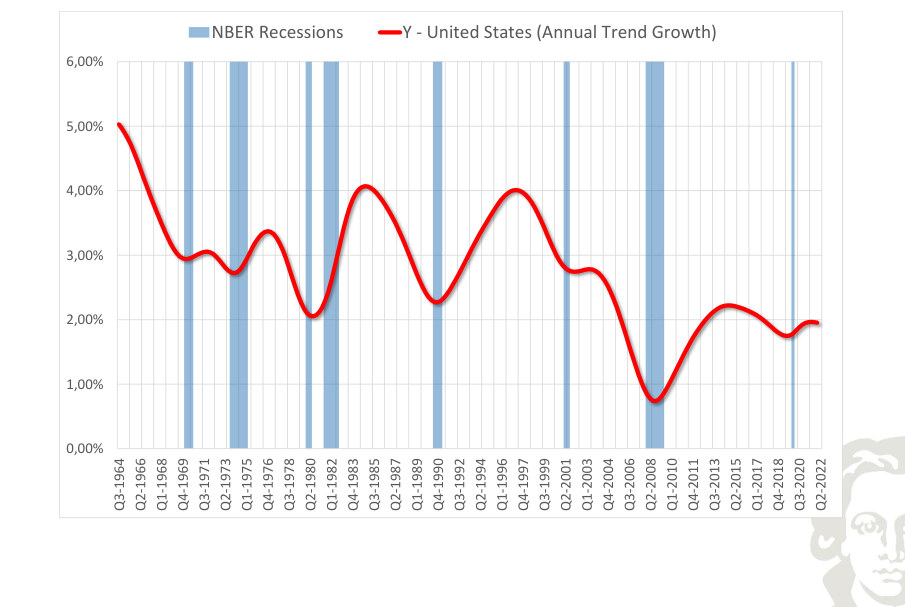
The smoothed growth path of real output in the United States describes the slower-moving change in the rate of expansion. It should not be equated with the cyclical component: the trend-growth series may slow even when the level of activity continues to rise.
NBER Recessions Y - United States (Deviations from Trend)
Fit to text
Scroll horizontally to inspect the labels and values.
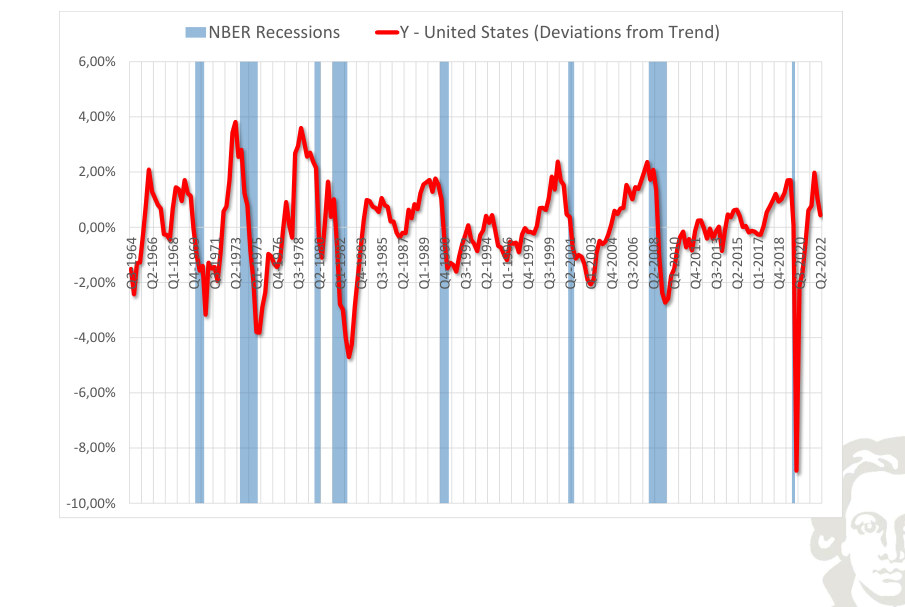
Detrended real output for the United States highlights movements above and below the estimated long-run path. The horizontal zero line is a normalization relative to the chosen filter, not a literal condition of zero production. Compare the timing and amplitude of these fluctuations with the corresponding output series.
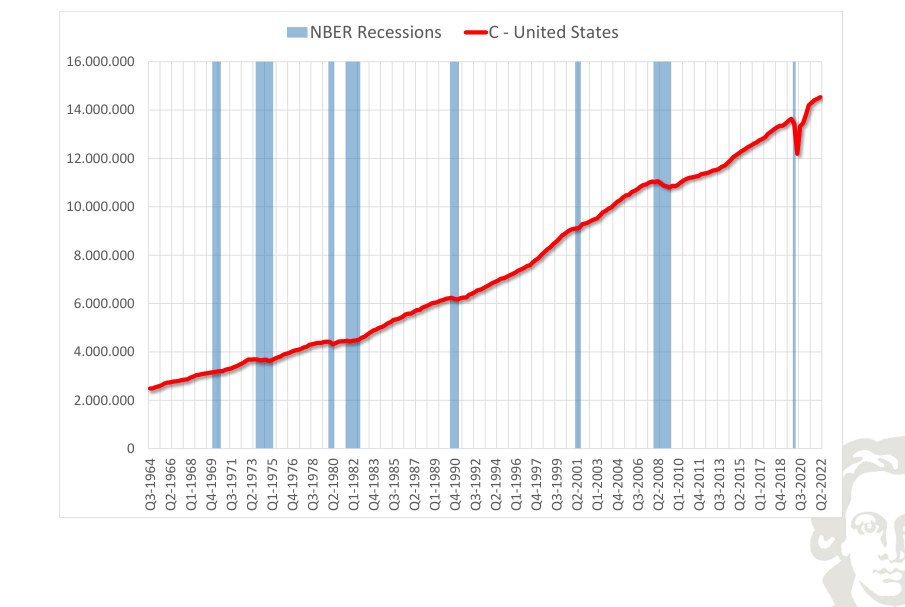
NBER Recessions C - United States
Fit to text
Scroll horizontally to inspect the labels and values.
NBER Recessions C - United States (Annual Growth)
Fit to text
Scroll horizontally to inspect the labels and values.
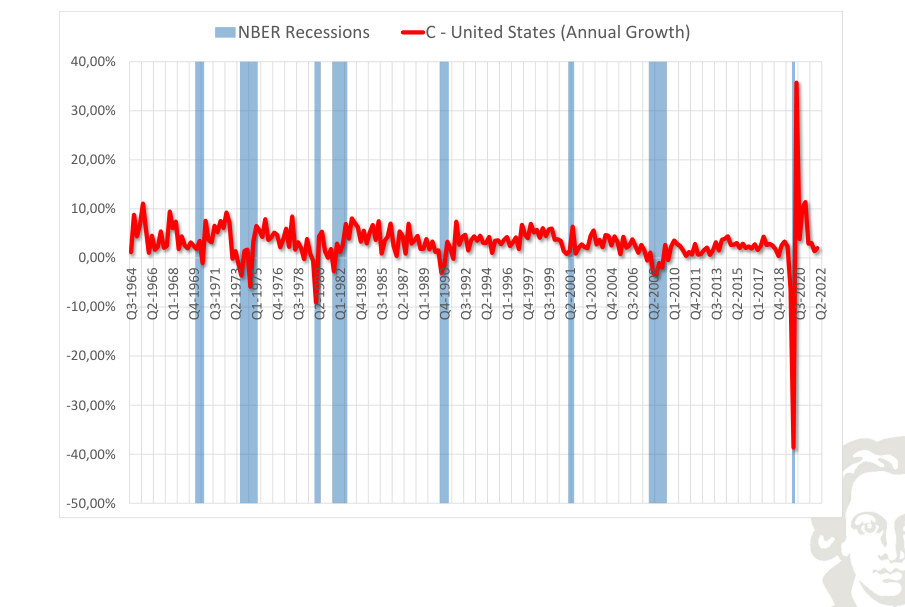
The plotted growth rate of consumption for the United States measures the change in activity under the frequency and rate convention of the series. Negative growth and below-trend growth are different concepts; comparing them helps identify contractions without assuming that every slowing constitutes a recession.
NBER Recessions C - United States (Annual Trend Growth)
Fit to text
Scroll horizontally to inspect the labels and values.
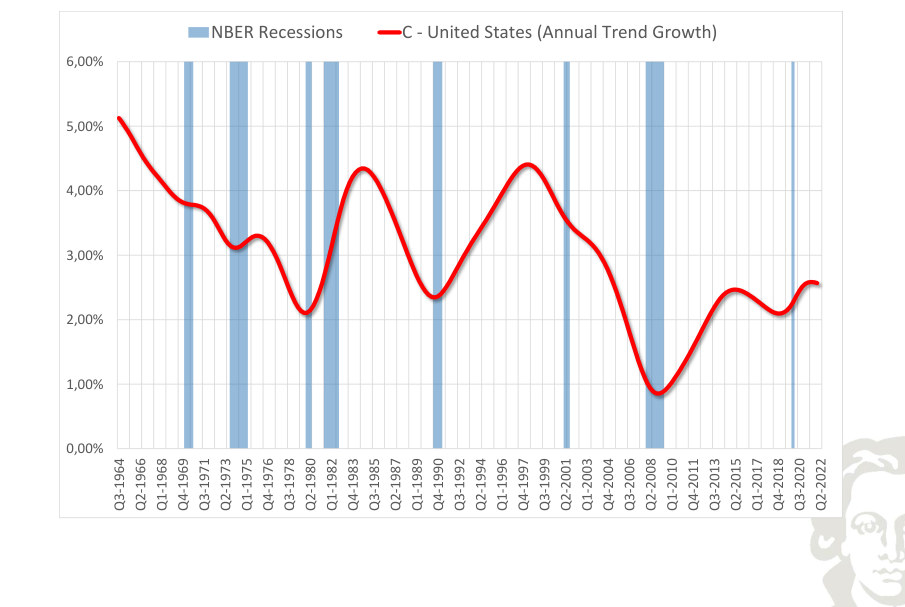
The smoothed growth path of consumption in the United States describes the slower-moving change in the rate of expansion. It should not be equated with the cyclical component: the trend-growth series may slow even when the level of activity continues to rise.
NBER Recessions C - United States (Deviations from Trend)
Fit to text
Scroll horizontally to inspect the labels and values.
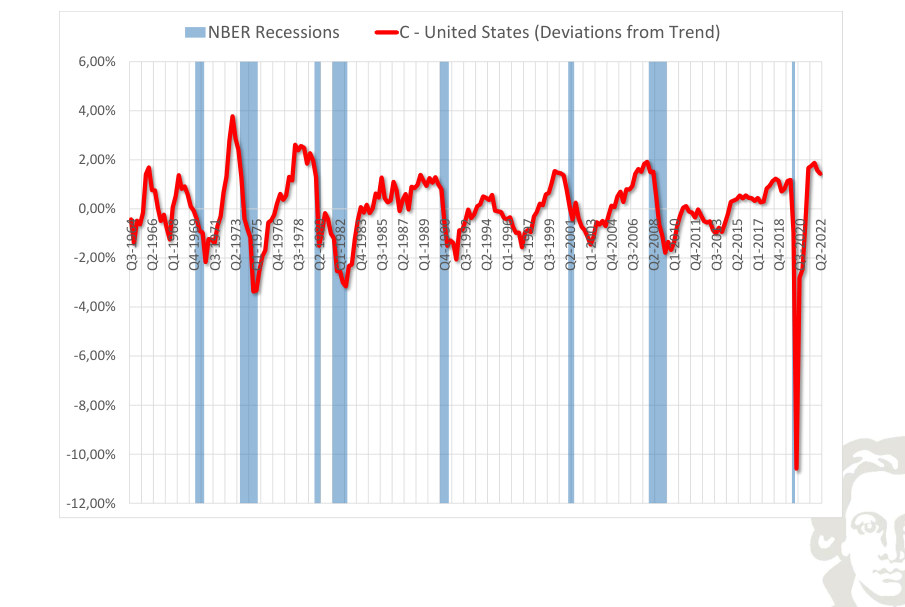
Detrended consumption for the United States highlights movements above and below the estimated long-run path. The horizontal zero line is a normalization relative to the chosen filter, not a literal condition of zero production. Compare the timing and amplitude of these fluctuations with the corresponding output series.
NBER Recessions I - United States
Fit to text
Scroll horizontally to inspect the labels and values.
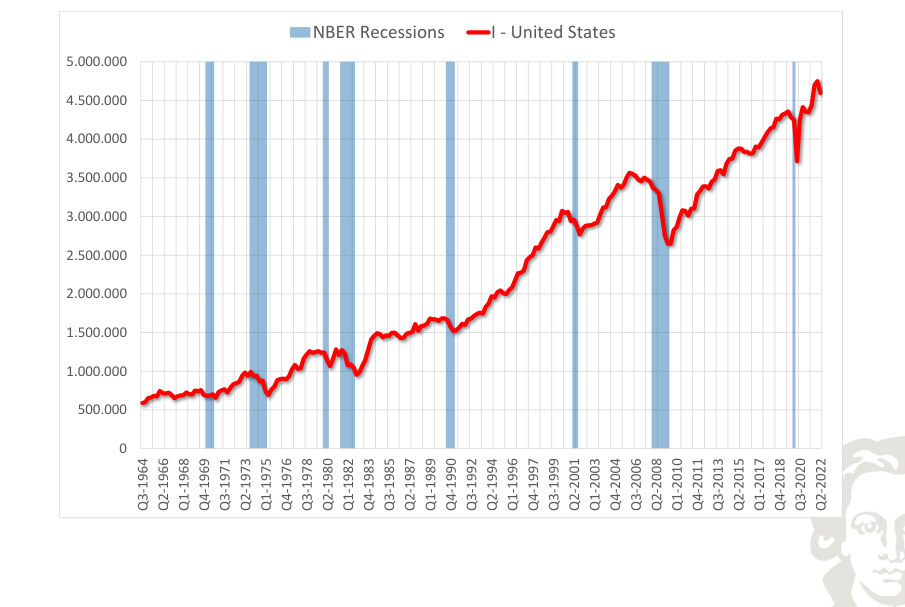
NBER Recessions I - United States (Annual Growth)
Fit to text
Scroll horizontally to inspect the labels and values.
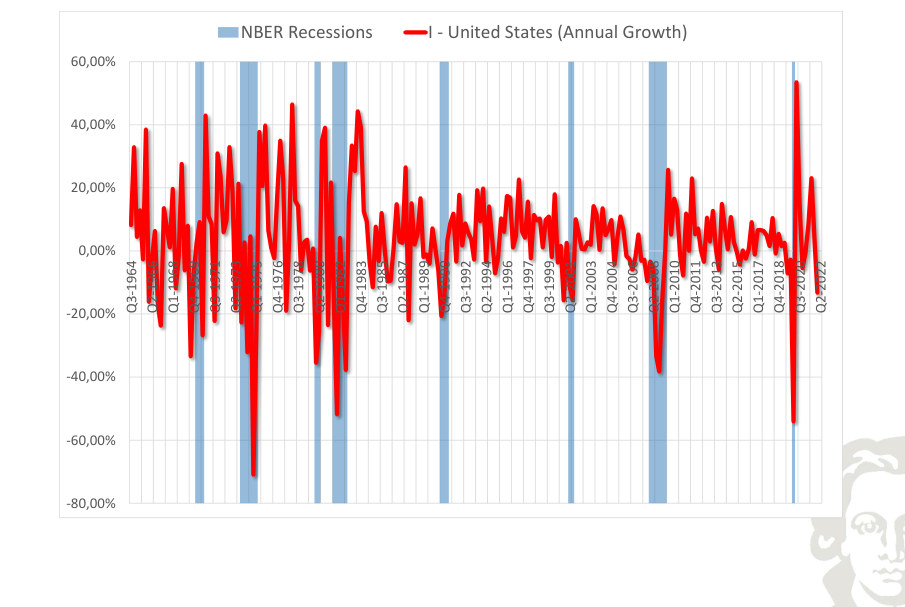
The plotted growth rate of investment for the United States measures the change in activity under the frequency and rate convention of the series. Negative growth and below-trend growth are different concepts; comparing them helps identify contractions without assuming that every slowing constitutes a recession.
NBER Recessions I - United States (Annual Trend Growth)
Fit to text
Scroll horizontally to inspect the labels and values.
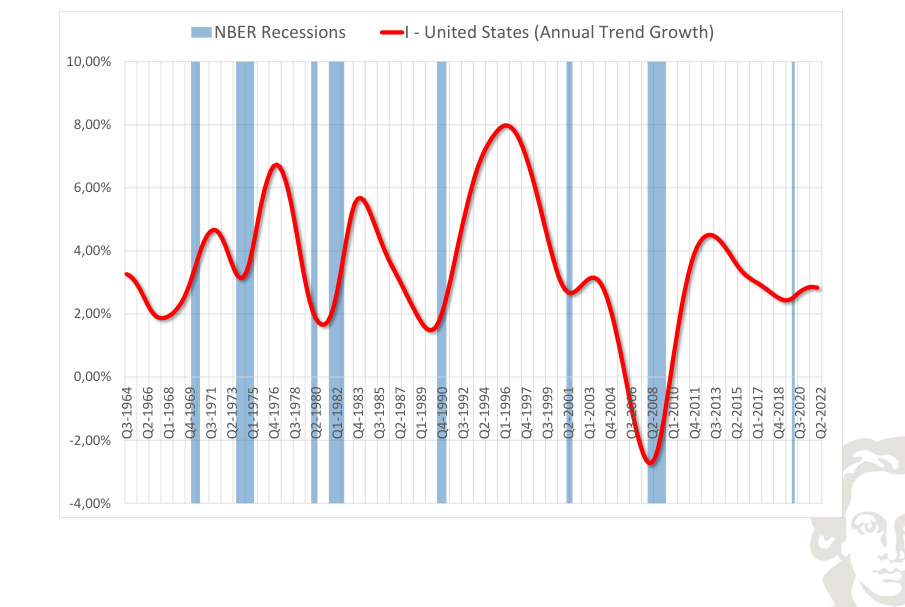
The smoothed growth path of investment in the United States describes the slower-moving change in the rate of expansion. It should not be equated with the cyclical component: the trend-growth series may slow even when the level of activity continues to rise.
NBER Recessions I - United States (Deviations from Trend)
Fit to text
Scroll horizontally to inspect the labels and values.
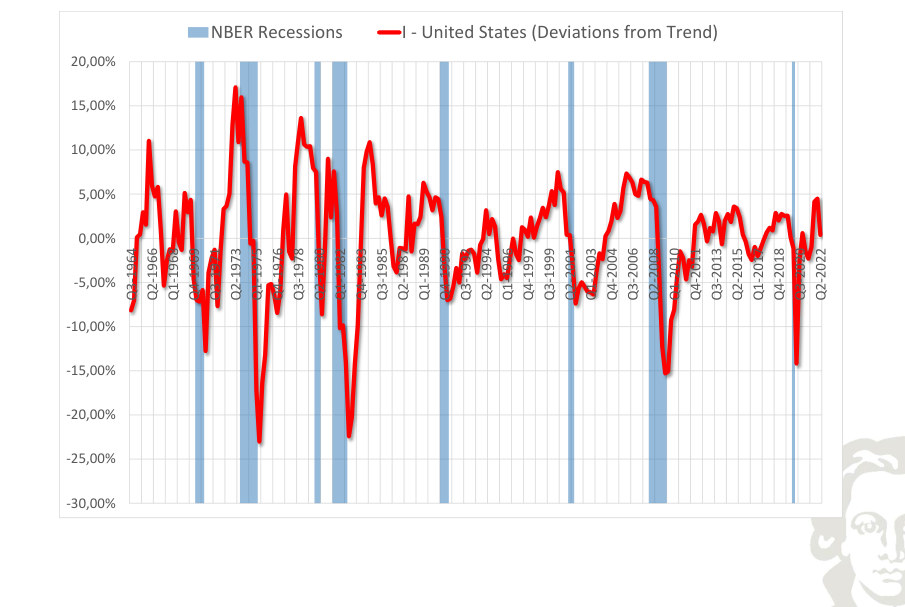
Detrended investment for the United States highlights movements above and below the estimated long-run path. The horizontal zero line is a normalization relative to the chosen filter, not a literal condition of zero production. Compare the timing and amplitude of these fluctuations with the corresponding output series.
NBER Recessions G - United States
Fit to text
Scroll horizontally to inspect the labels and values.
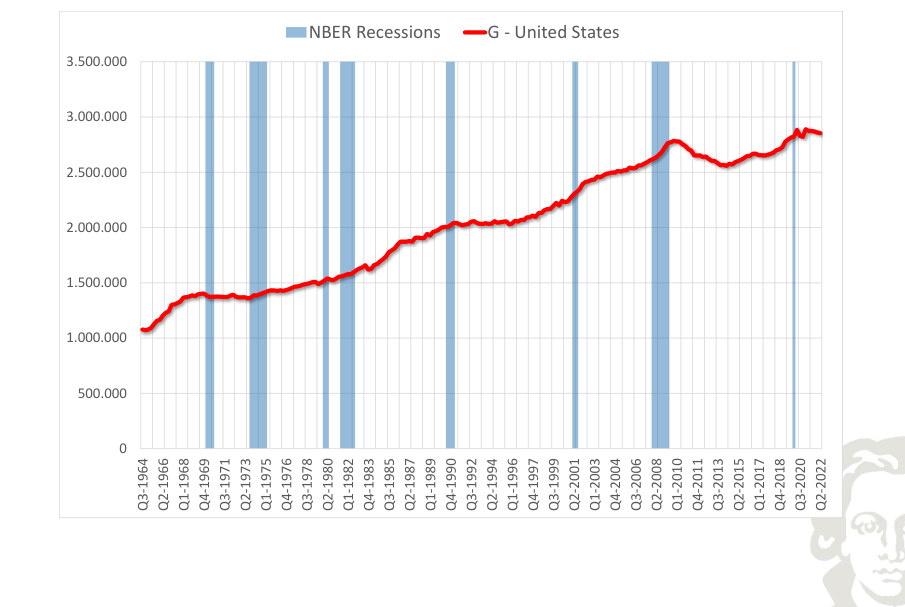
NBER Recessions G - United States (Annual Growth)
Fit to text
Scroll horizontally to inspect the labels and values.
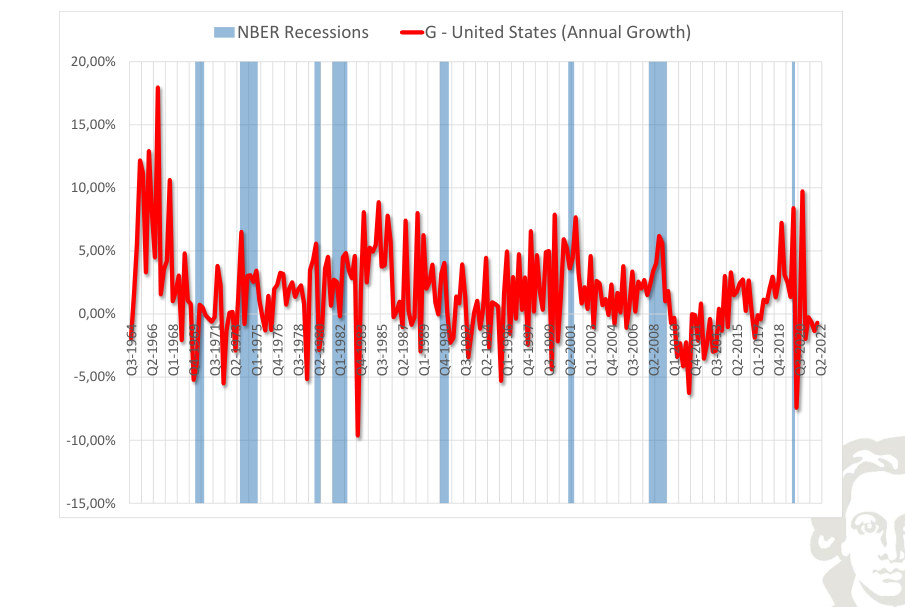
The plotted growth rate of government expenditure for the United States measures the change in activity under the frequency and rate convention of the series. Negative growth and below-trend growth are different concepts; comparing them helps identify contractions without assuming that every slowing constitutes a recession.
NBER Recessions G - United States (Annual Trend Growth)
Fit to text
Scroll horizontally to inspect the labels and values.
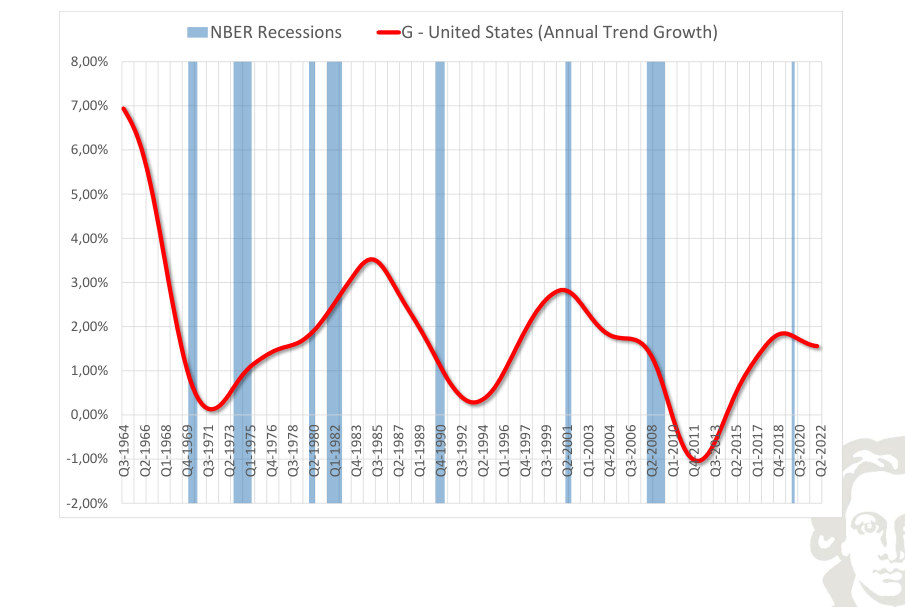
The smoothed growth path of government expenditure in the United States describes the slower-moving change in the rate of expansion. It should not be equated with the cyclical component: the trend-growth series may slow even when the level of activity continues to rise.
NBER Recessions G - United States (Deviations from Trend)
Fit to text
Scroll horizontally to inspect the labels and values.
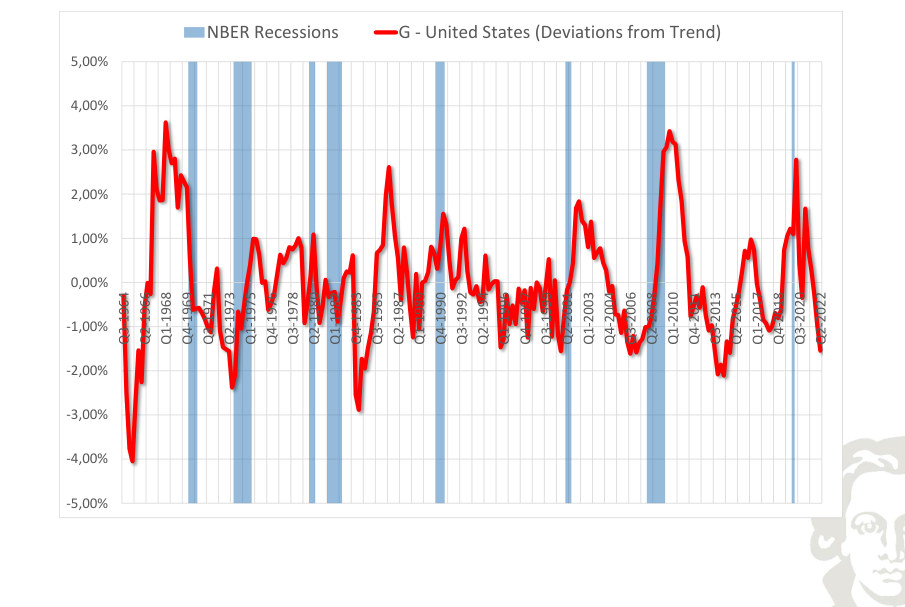
Detrended government expenditure for the United States highlights movements above and below the estimated long-run path. The horizontal zero line is a normalization relative to the chosen filter, not a literal condition of zero production. Compare the timing and amplitude of these fluctuations with the corresponding output series.
NBER Recessions X - United States
Fit to text
Scroll horizontally to inspect the labels and values.
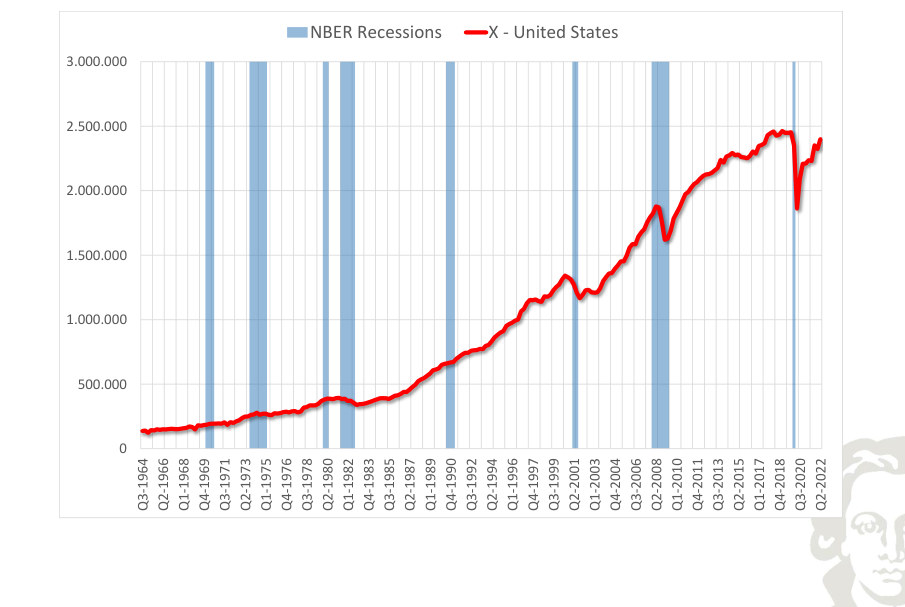
NBER Recessions X - United States (Annual Growth)
Fit to text
Scroll horizontally to inspect the labels and values.
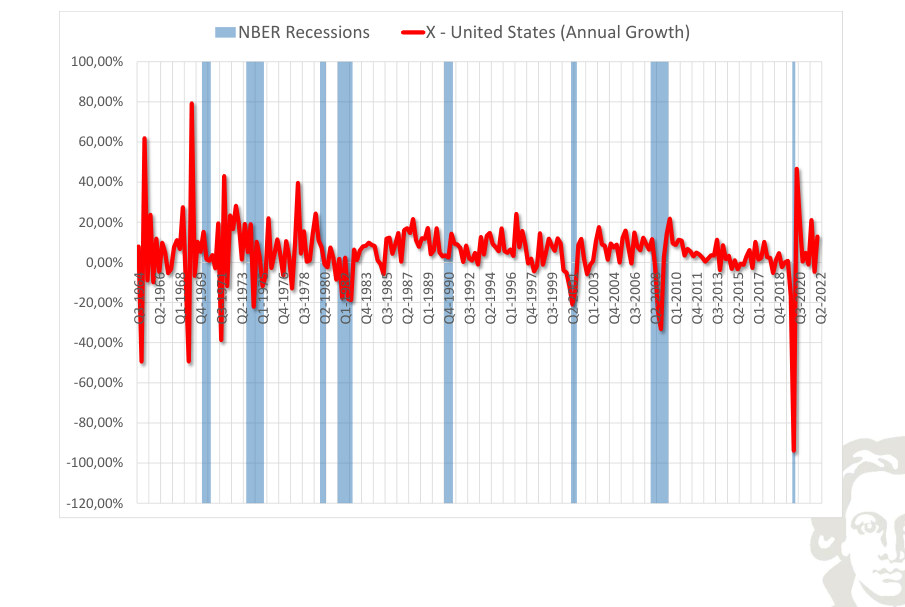
The plotted growth rate of exports for the United States measures the change in activity under the frequency and rate convention of the series. Negative growth and below-trend growth are different concepts; comparing them helps identify contractions without assuming that every slowing constitutes a recession.
NBER Recessions X - United States (Annual Trend Growth)
Fit to text
Scroll horizontally to inspect the labels and values.
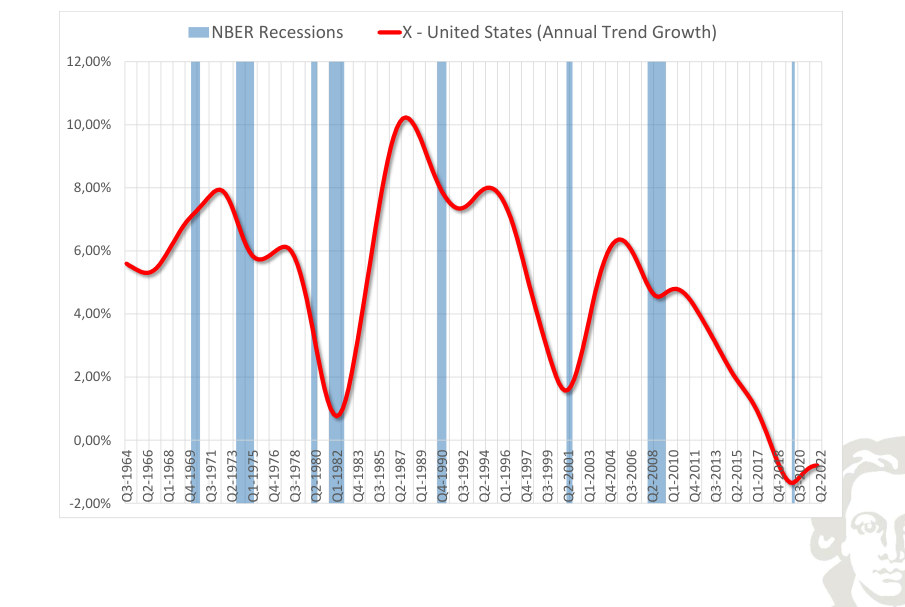
The smoothed growth path of exports in the United States describes the slower-moving change in the rate of expansion. It should not be equated with the cyclical component: the trend-growth series may slow even when the level of activity continues to rise.
NBER Recessions X - United States (Deviations from Trend)
Fit to text
Scroll horizontally to inspect the labels and values.
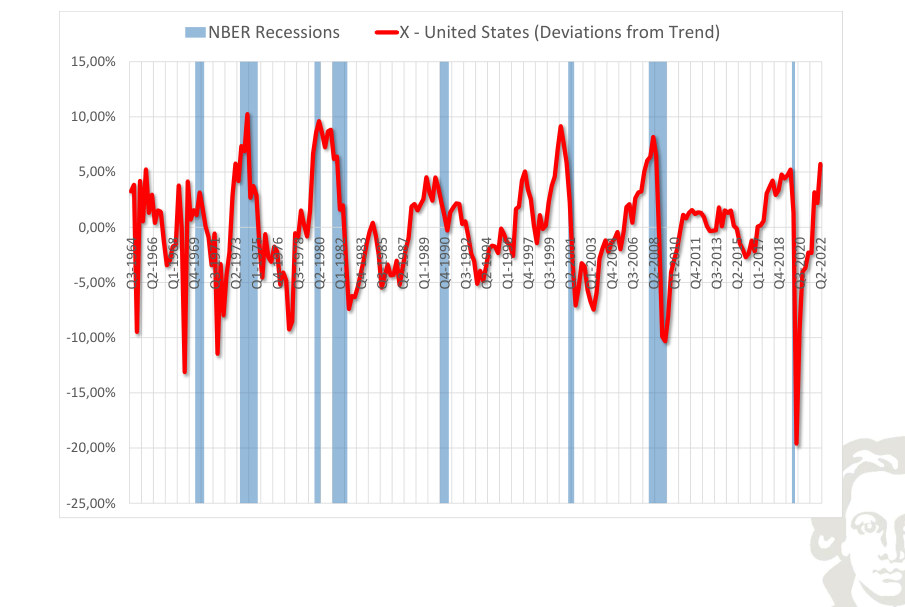
Detrended exports for the United States highlights movements above and below the estimated long-run path. The horizontal zero line is a normalization relative to the chosen filter, not a literal condition of zero production. Compare the timing and amplitude of these fluctuations with the corresponding output series.
NBER Recessions Z - United States
Fit to text
Scroll horizontally to inspect the labels and values.
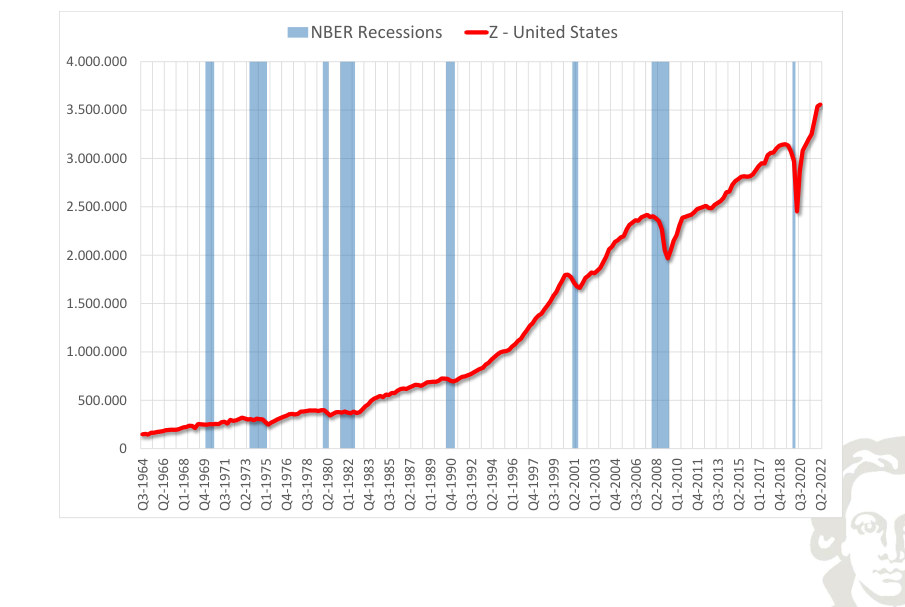
NBER Recessions Z - United States (Annual Growth)
Fit to text
Scroll horizontally to inspect the labels and values.
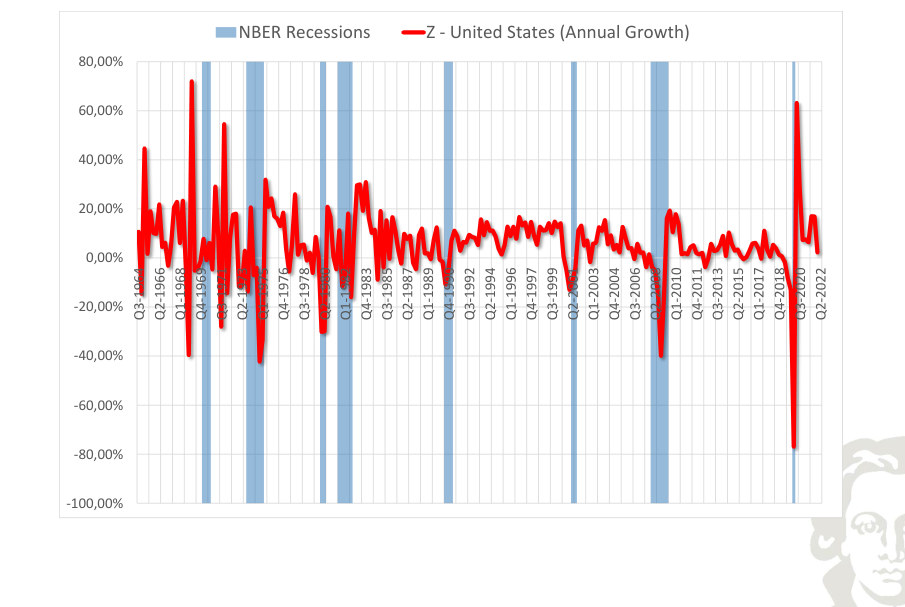
The plotted growth rate of imports for the United States measures the change in activity under the frequency and rate convention of the series. Negative growth and below-trend growth are different concepts; comparing them helps identify contractions without assuming that every slowing constitutes a recession.
NBER Recessions Z - United States (Annual Trend Growth)
Fit to text
Scroll horizontally to inspect the labels and values.
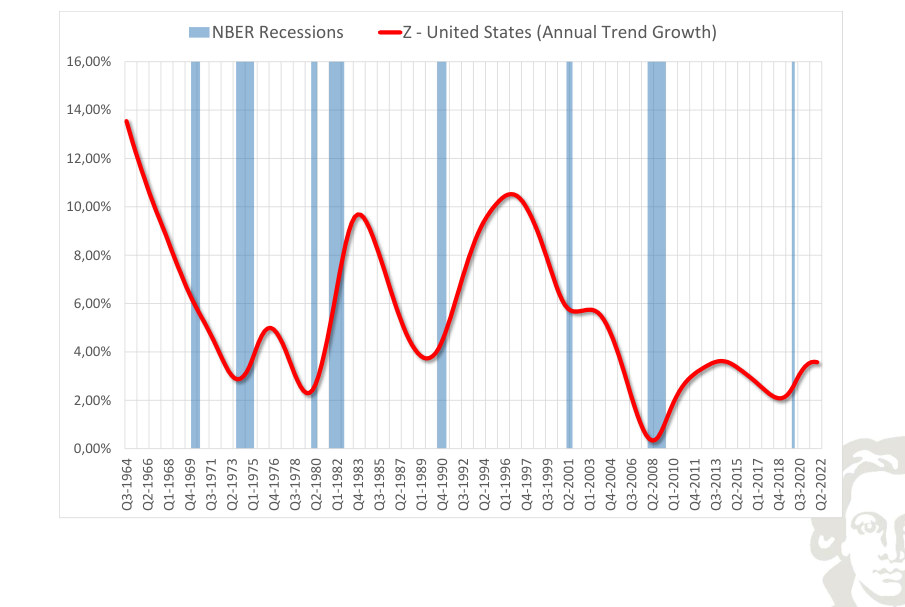
The smoothed growth path of imports in the United States describes the slower-moving change in the rate of expansion. It should not be equated with the cyclical component: the trend-growth series may slow even when the level of activity continues to rise.
NBER Recessions Z - United States (Deviations from Trend)
Fit to text
Scroll horizontally to inspect the labels and values.
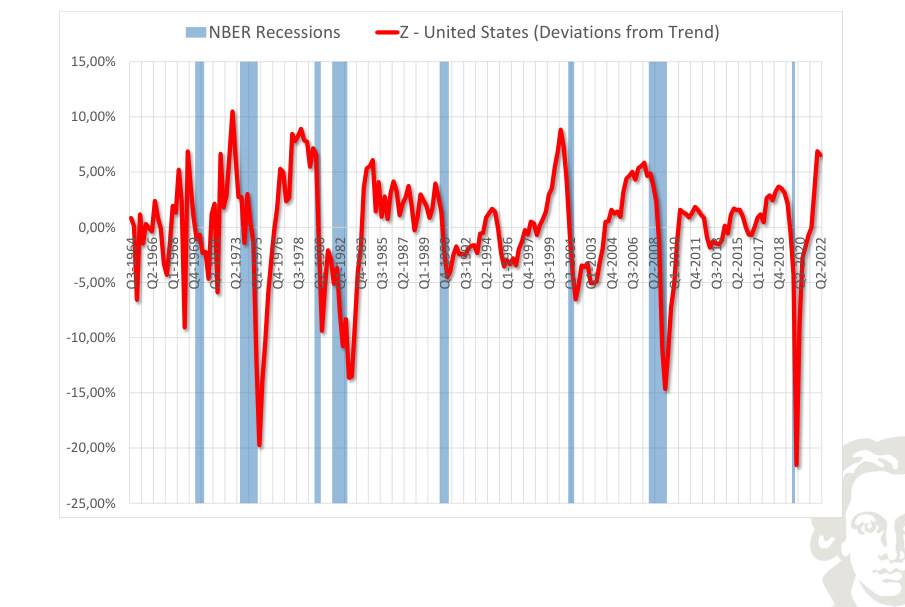
Detrended imports for the United States highlights movements above and below the estimated long-run path. The horizontal zero line is a normalization relative to the chosen filter, not a literal condition of zero production. Compare the timing and amplitude of these fluctuations with the corresponding output series.
EU (18) · country series
CEPR Y - Euro area
Fit to text
Scroll horizontally to inspect the labels and values.
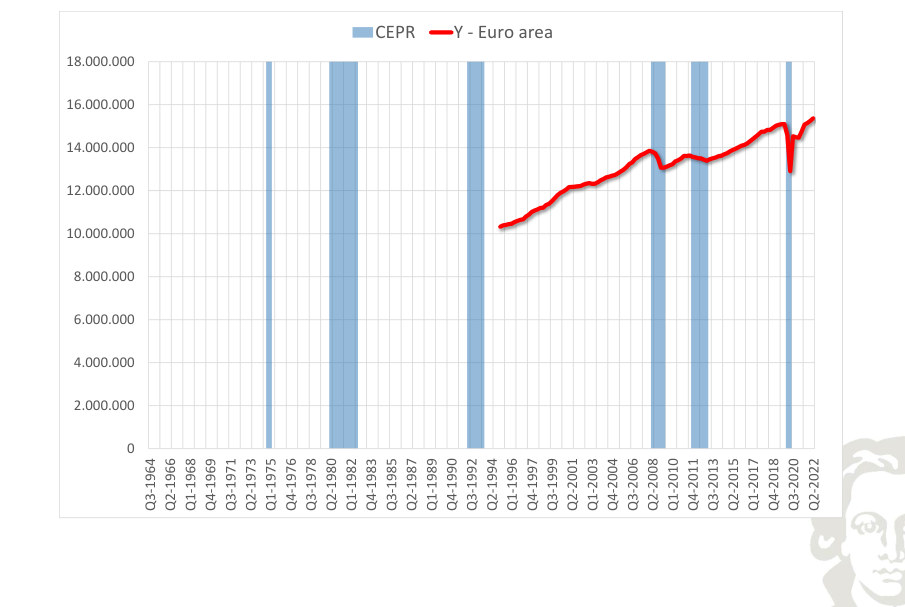
CEPR Y - Euro area (Annual Growth)
Fit to text
Scroll horizontally to inspect the labels and values.
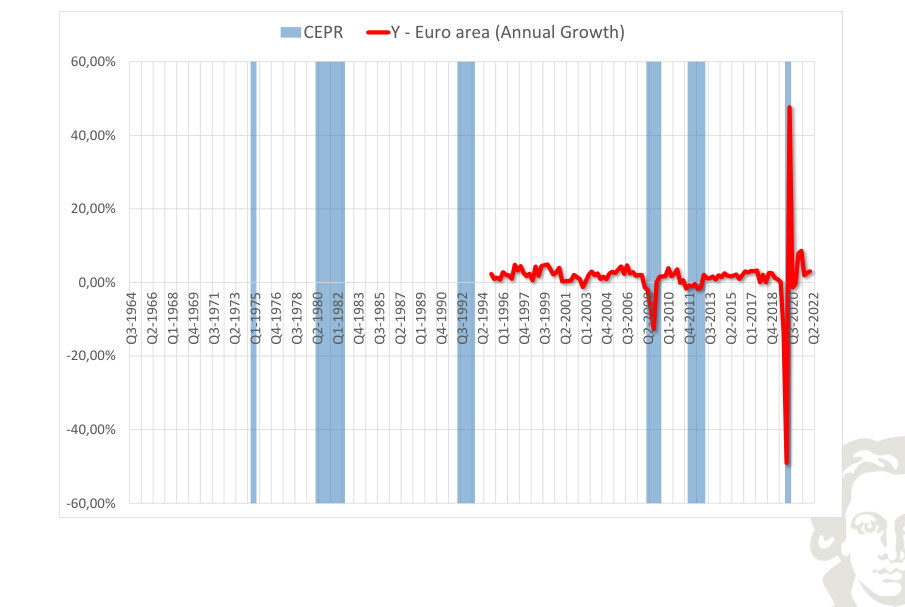
The plotted growth rate of real output for the selected economy measures the change in activity under the frequency and rate convention of the series. Negative growth and below-trend growth are different concepts; comparing them helps identify contractions without assuming that every slowing constitutes a recession.
CEPR Y - Euro area (Annual Trend Growth)
Fit to text
Scroll horizontally to inspect the labels and values.
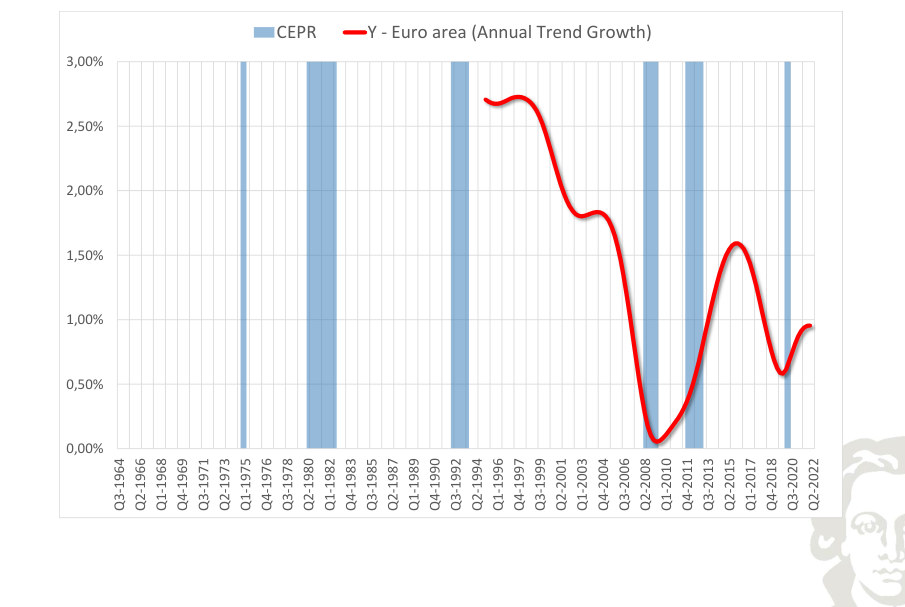
The smoothed growth path of real output in the selected economy describes the slower-moving change in the rate of expansion. It should not be equated with the cyclical component: the trend-growth series may slow even when the level of activity continues to rise.
CEPR Y - Euro area (Deviations from Trend)
Fit to text
Scroll horizontally to inspect the labels and values.
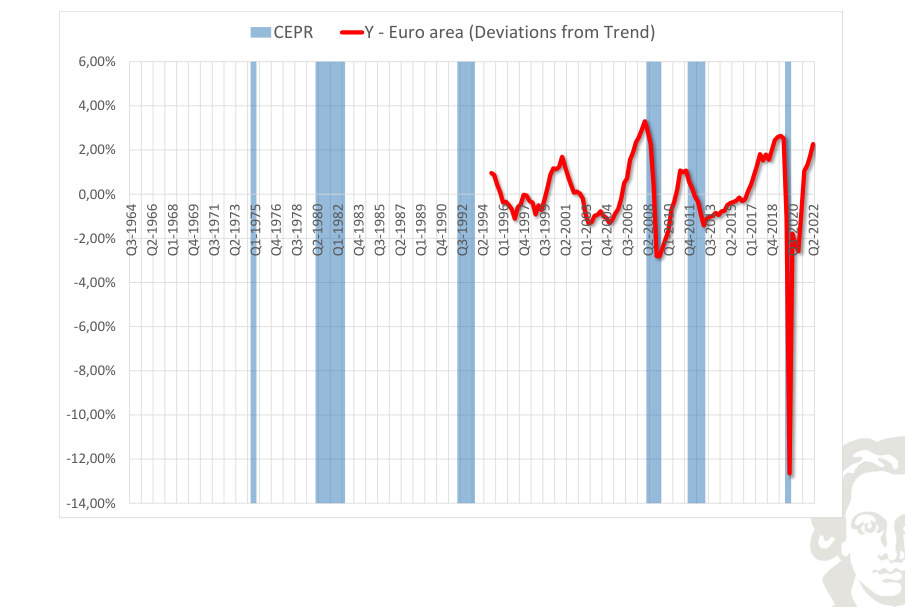
Detrended real output for the selected economy highlights movements above and below the estimated long-run path. The horizontal zero line is a normalization relative to the chosen filter, not a literal condition of zero production. Compare the timing and amplitude of these fluctuations with the corresponding output series.
CEPR C - Euro area
Fit to text
Scroll horizontally to inspect the labels and values.
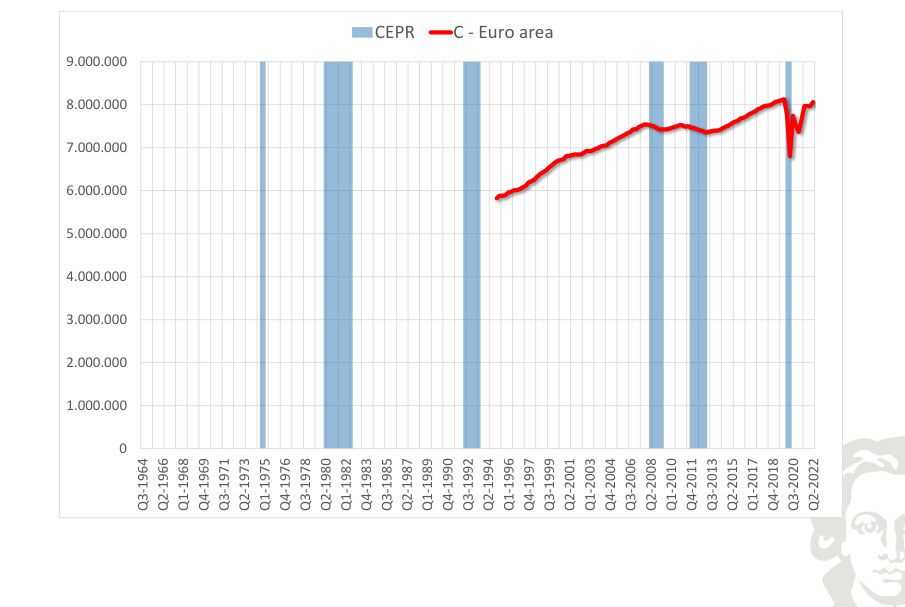
CEPR C - Euro area (Annual Growth)
Fit to text
Scroll horizontally to inspect the labels and values.
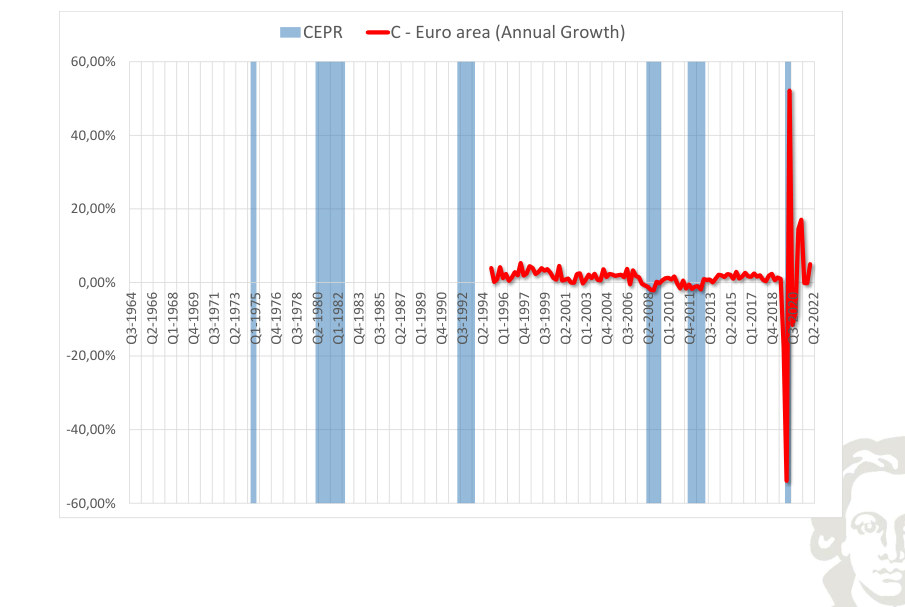
The plotted growth rate of consumption for the selected economy measures the change in activity under the frequency and rate convention of the series. Negative growth and below-trend growth are different concepts; comparing them helps identify contractions without assuming that every slowing constitutes a recession.
CEPR C - Euro area (Annual Trend Growth)
Fit to text
Scroll horizontally to inspect the labels and values.
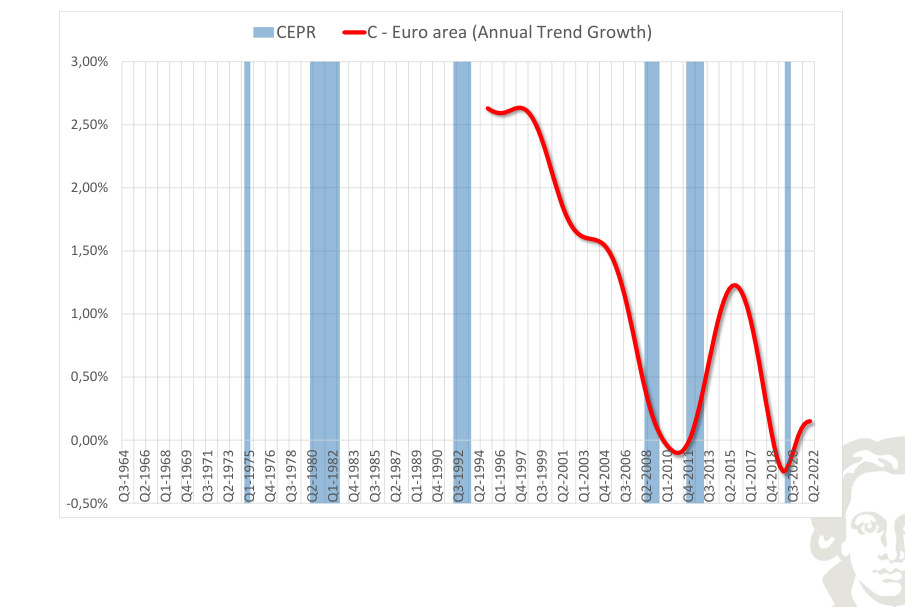
The smoothed growth path of consumption in the selected economy describes the slower-moving change in the rate of expansion. It should not be equated with the cyclical component: the trend-growth series may slow even when the level of activity continues to rise.
CEPR C - Euro Area (Deviations from Trend)
Fit to text
Scroll horizontally to inspect the labels and values.
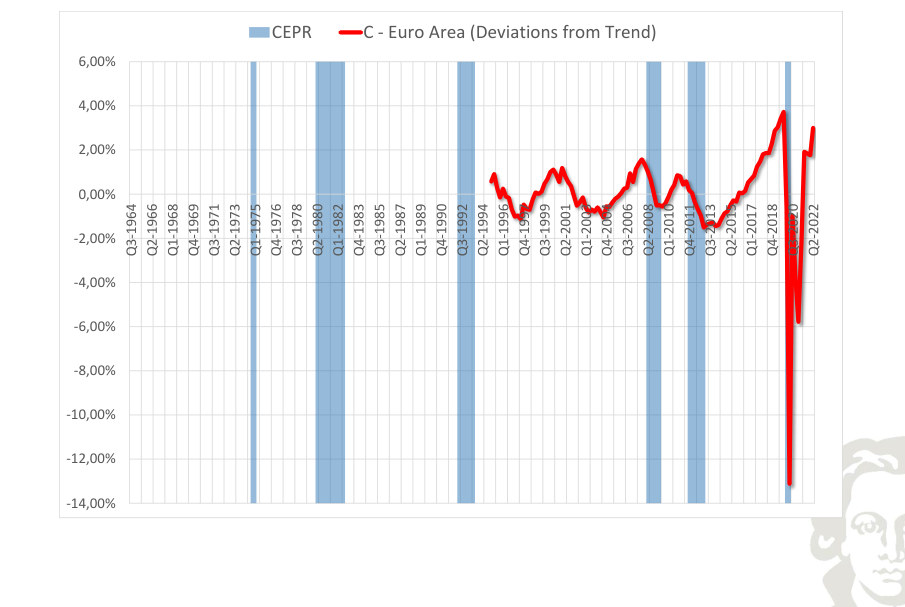
Detrended consumption for the selected economy highlights movements above and below the estimated long-run path. The horizontal zero line is a normalization relative to the chosen filter, not a literal condition of zero production. Compare the timing and amplitude of these fluctuations with the corresponding output series.
CEPR I - Euro area
Fit to text
Scroll horizontally to inspect the labels and values.
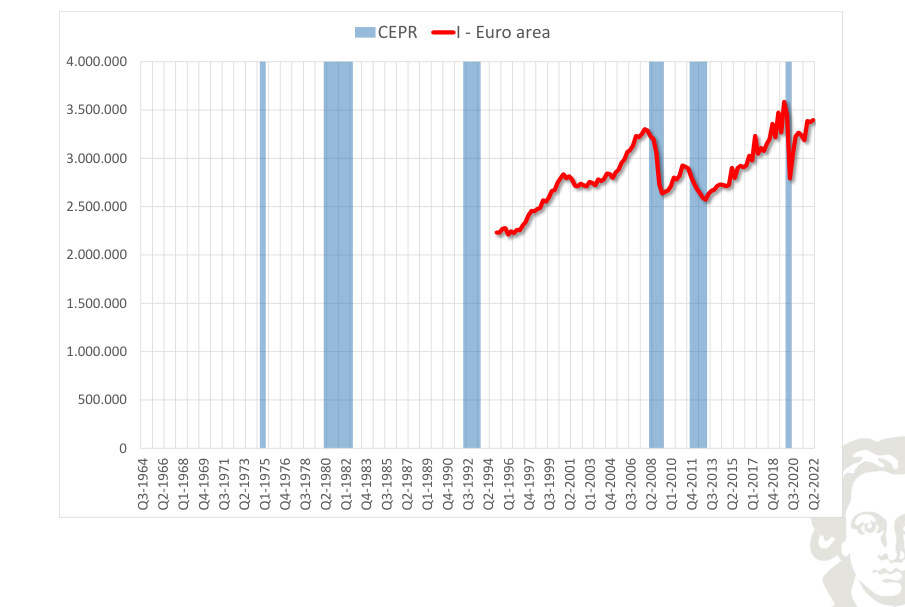
CEPR I - Euro area (Annual Growth)
Fit to text
Scroll horizontally to inspect the labels and values.
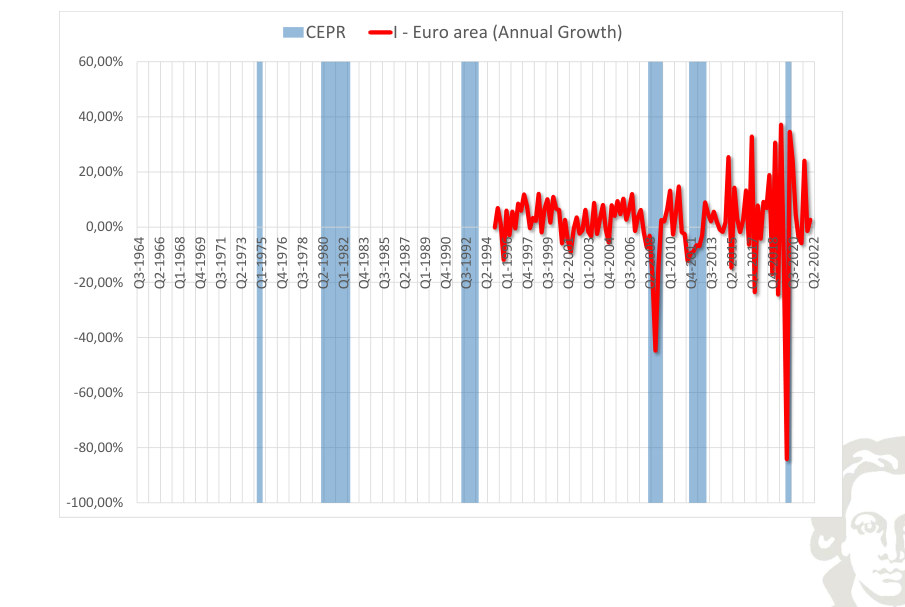
The plotted growth rate of investment for the selected economy measures the change in activity under the frequency and rate convention of the series. Negative growth and below-trend growth are different concepts; comparing them helps identify contractions without assuming that every slowing constitutes a recession.
CEPR I - Euro area (Annual Trend Growth)
Fit to text
Scroll horizontally to inspect the labels and values.
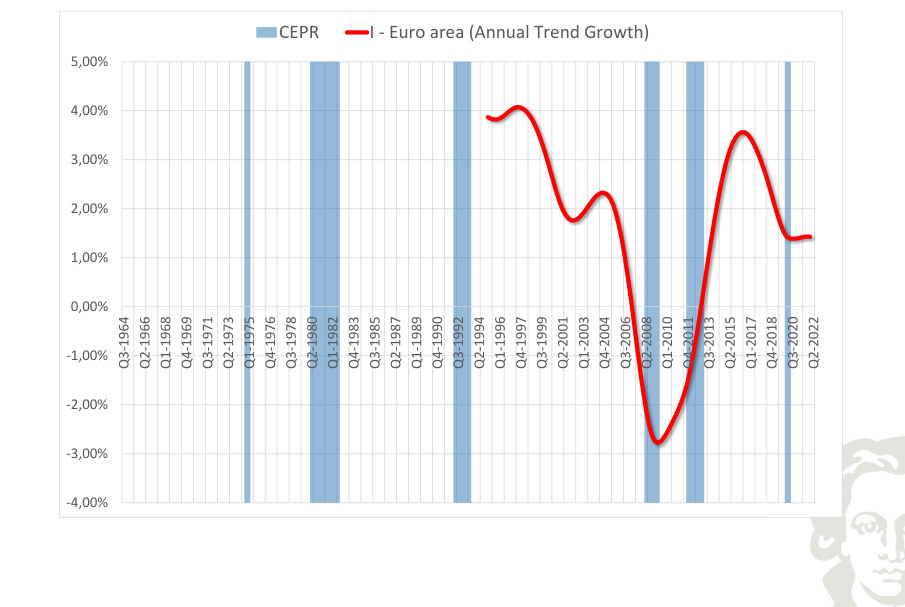
The smoothed growth path of investment in the selected economy describes the slower-moving change in the rate of expansion. It should not be equated with the cyclical component: the trend-growth series may slow even when the level of activity continues to rise.
CEPR I - Euro Area (Deviations from Trend)
Fit to text
Scroll horizontally to inspect the labels and values.
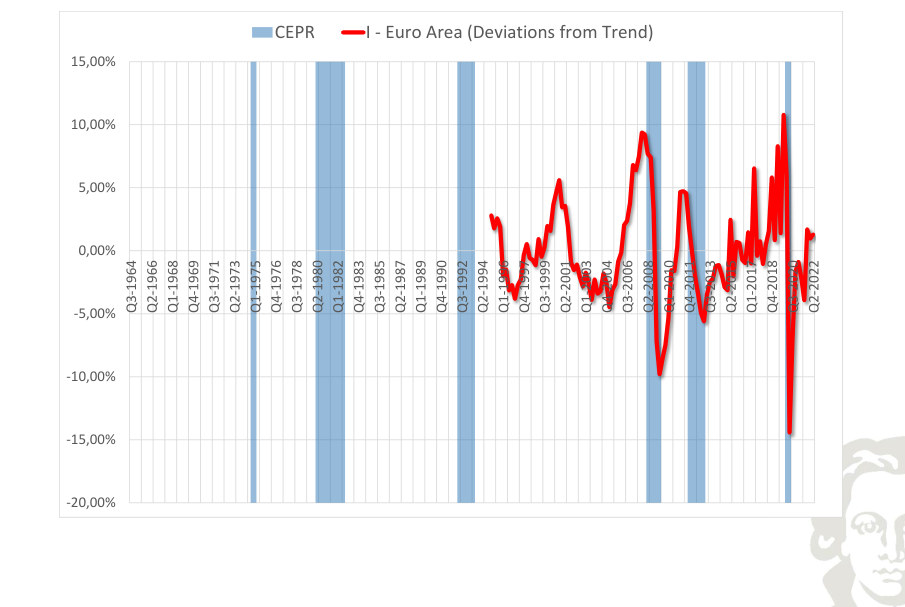
Detrended investment for the selected economy highlights movements above and below the estimated long-run path. The horizontal zero line is a normalization relative to the chosen filter, not a literal condition of zero production. Compare the timing and amplitude of these fluctuations with the corresponding output series.
CEPR G - Euro area
Fit to text
Scroll horizontally to inspect the labels and values.
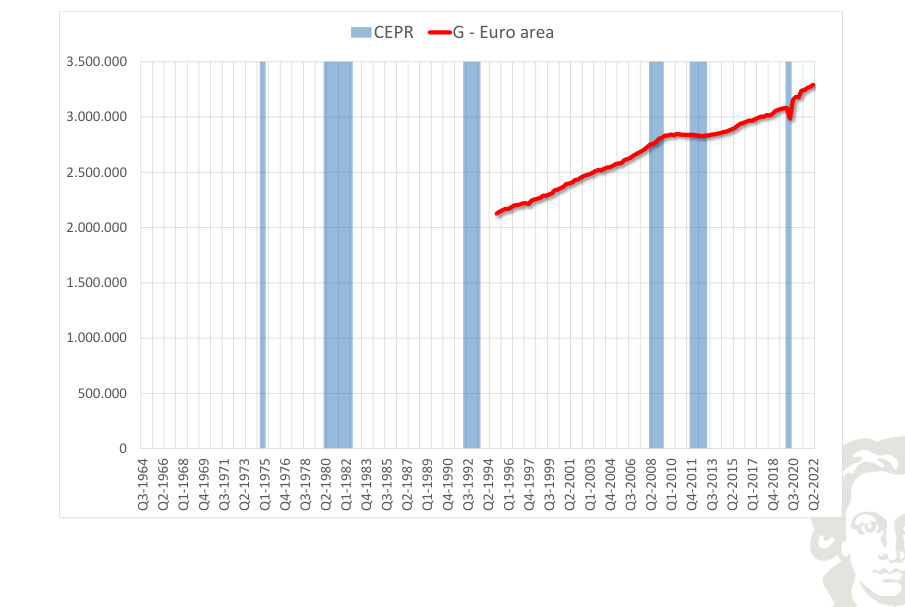
CEPR G - Euro area (Annual Growth)
Fit to text
Scroll horizontally to inspect the labels and values.
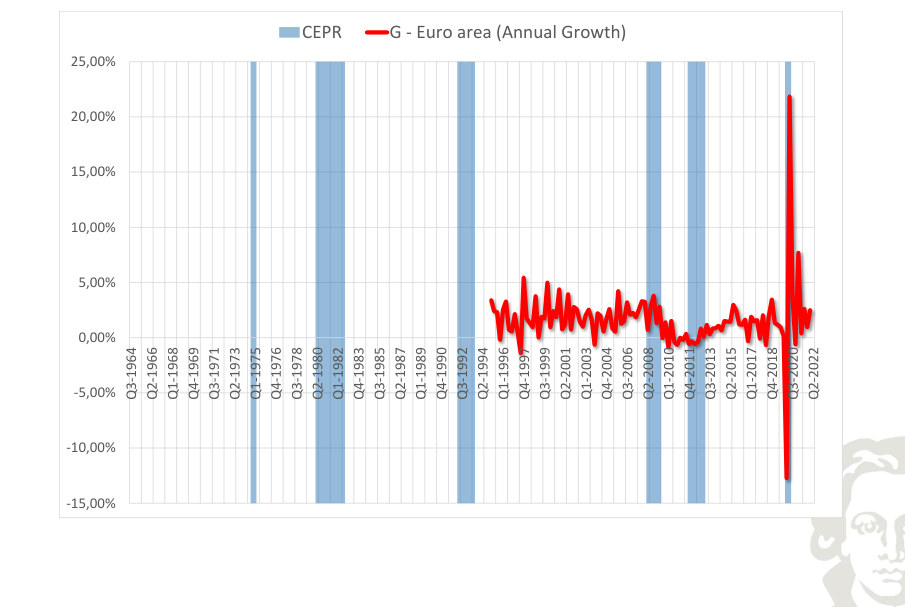
The plotted growth rate of government expenditure for the selected economy measures the change in activity under the frequency and rate convention of the series. Negative growth and below-trend growth are different concepts; comparing them helps identify contractions without assuming that every slowing constitutes a recession.
CEPR G - Euro area (Annual Trend Growth)
Fit to text
Scroll horizontally to inspect the labels and values.
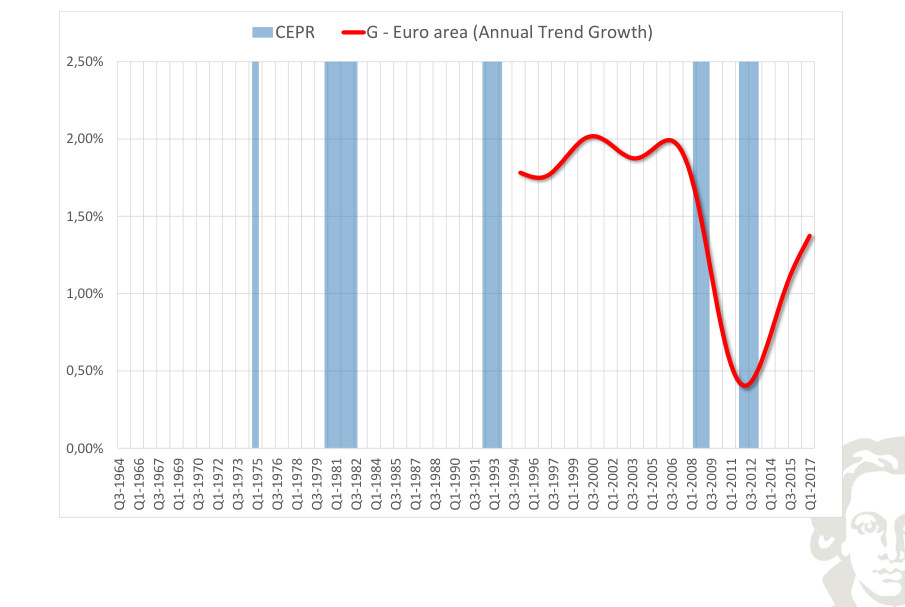
The smoothed growth path of government expenditure in the selected economy describes the slower-moving change in the rate of expansion. It should not be equated with the cyclical component: the trend-growth series may slow even when the level of activity continues to rise.
CEPR G - Euro area (Deviations from Trend)
Fit to text
Scroll horizontally to inspect the labels and values.
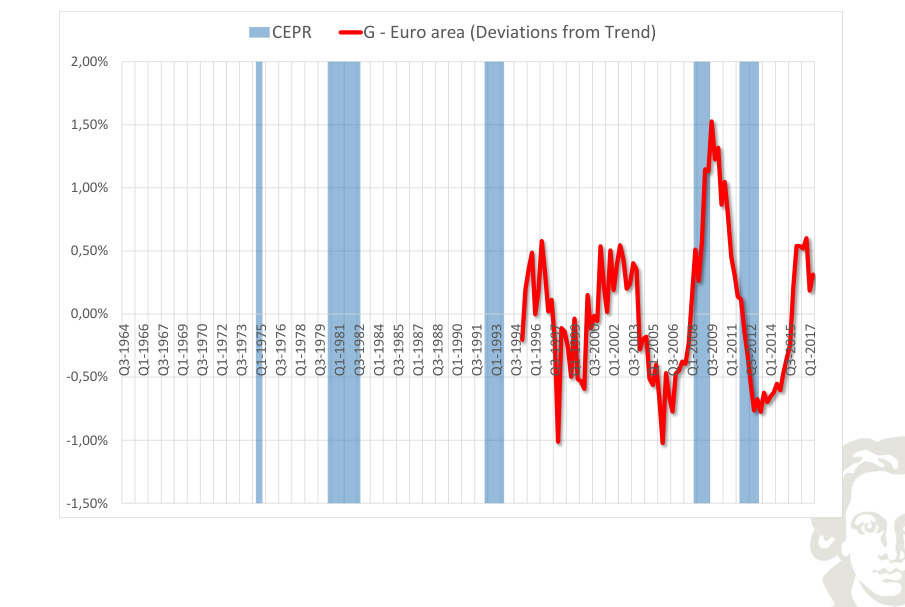
Detrended government expenditure for the selected economy highlights movements above and below the estimated long-run path. The horizontal zero line is a normalization relative to the chosen filter, not a literal condition of zero production. Compare the timing and amplitude of these fluctuations with the corresponding output series.
Japan · country series
OECD Japan Y - Japan
Fit to text
Scroll horizontally to inspect the labels and values.
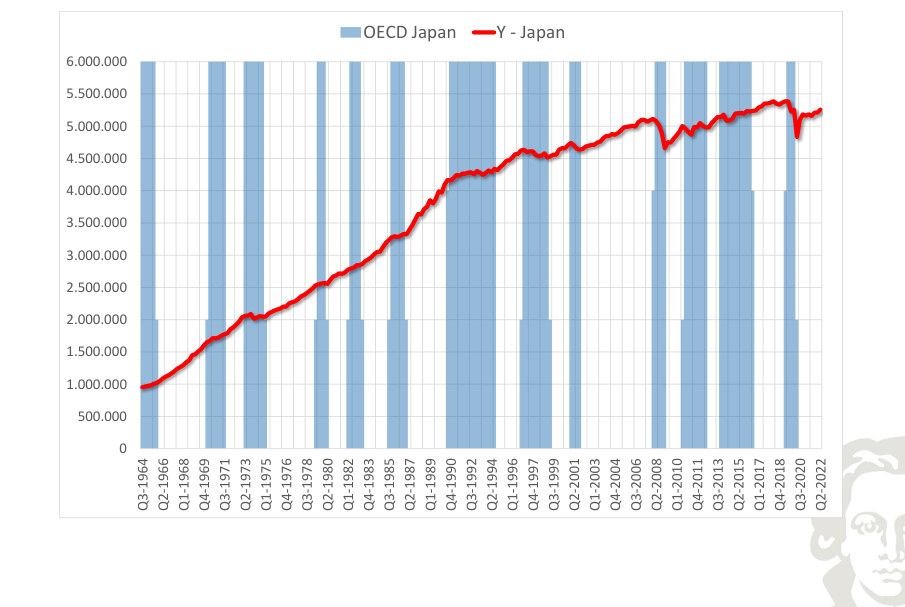
OECD Japan Y - Japan (Annual Growth)
Fit to text
Scroll horizontally to inspect the labels and values.
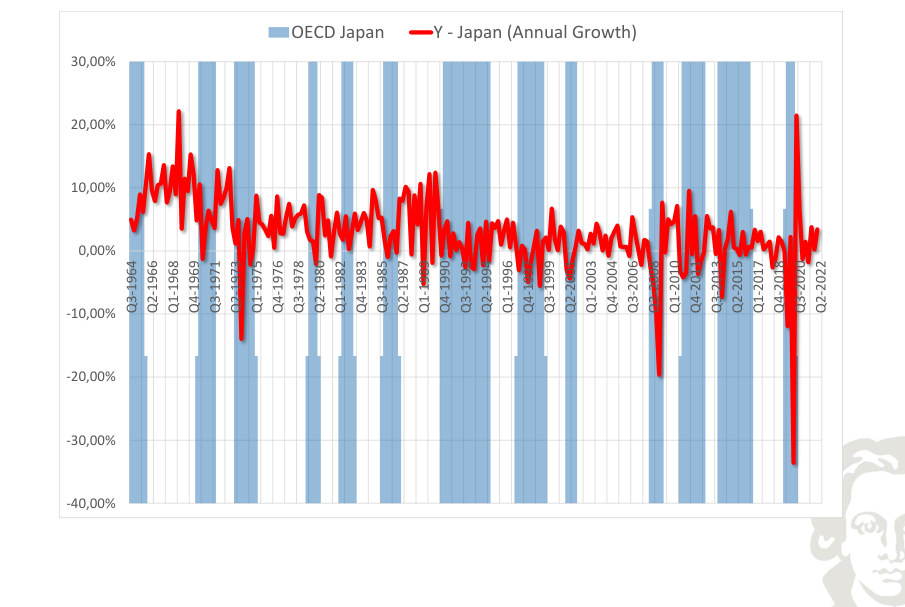
The plotted growth rate of real output for Japan measures the change in activity under the frequency and rate convention of the series. Negative growth and below-trend growth are different concepts; comparing them helps identify contractions without assuming that every slowing constitutes a recession.
OECD Japan Y - Japan (Annual Trend Growth)
Fit to text
Scroll horizontally to inspect the labels and values.
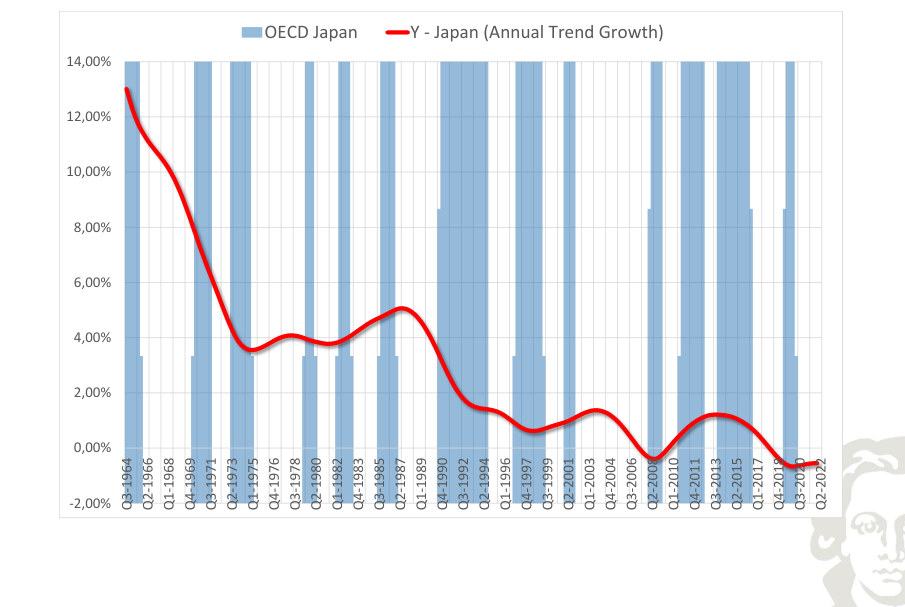
The smoothed growth path of real output in Japan describes the slower-moving change in the rate of expansion. It should not be equated with the cyclical component: the trend-growth series may slow even when the level of activity continues to rise.
OECD Japan Y - Japan (Deviations from Trend)
Fit to text
Scroll horizontally to inspect the labels and values.
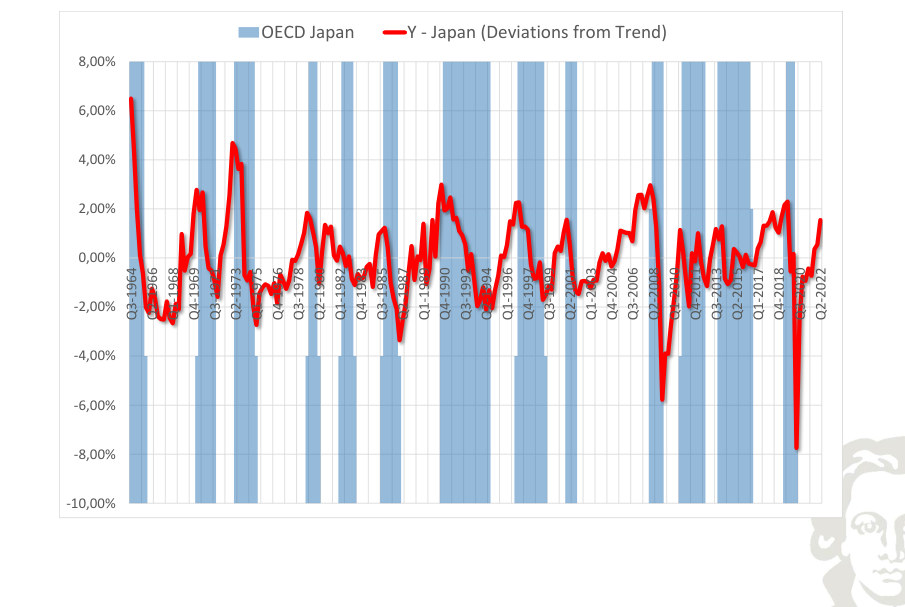
Detrended real output for Japan highlights movements above and below the estimated long-run path. The horizontal zero line is a normalization relative to the chosen filter, not a literal condition of zero production. Compare the timing and amplitude of these fluctuations with the corresponding output series.
OECD Japan C - Japan
Fit to text
Scroll horizontally to inspect the labels and values.
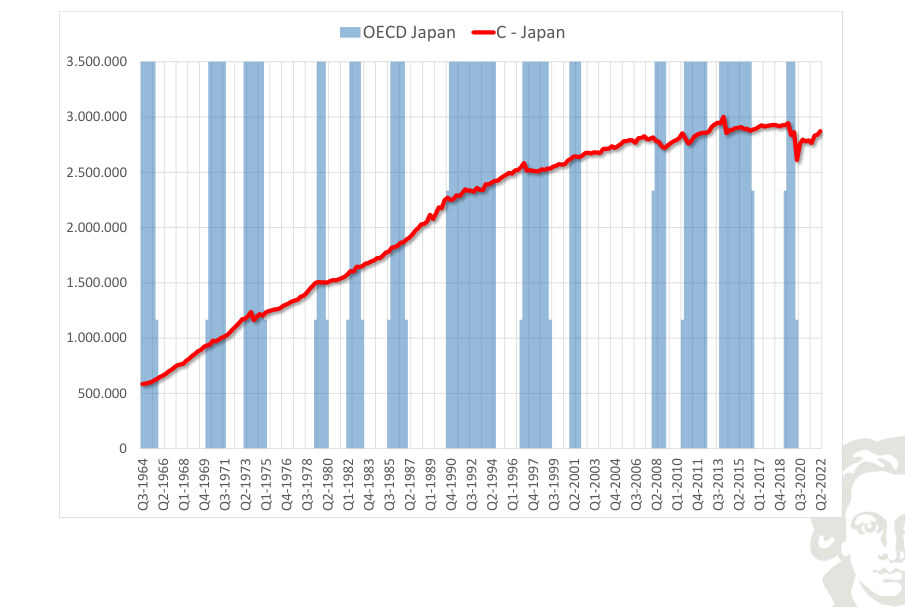
OECD Japan C - Japan (Annual Growth)
Fit to text
Scroll horizontally to inspect the labels and values.
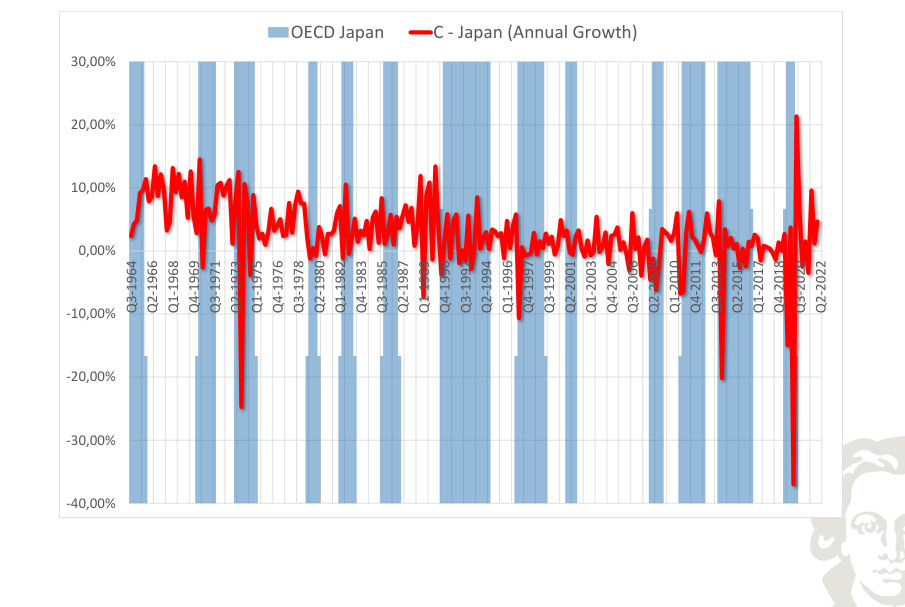
The plotted growth rate of consumption for Japan measures the change in activity under the frequency and rate convention of the series. Negative growth and below-trend growth are different concepts; comparing them helps identify contractions without assuming that every slowing constitutes a recession.
OECD Japan C - Japan (Annual Trend Growth)
Fit to text
Scroll horizontally to inspect the labels and values.
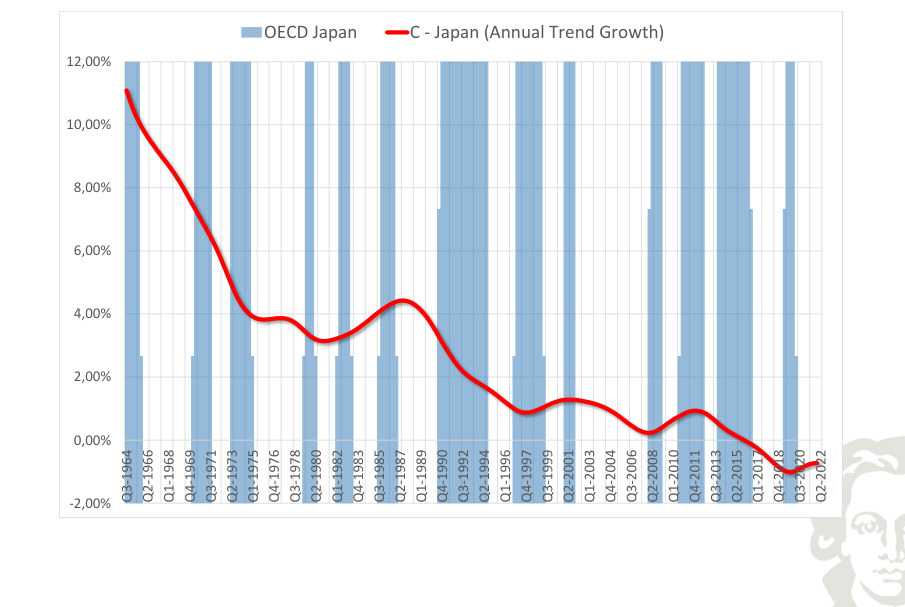
The smoothed growth path of consumption in Japan describes the slower-moving change in the rate of expansion. It should not be equated with the cyclical component: the trend-growth series may slow even when the level of activity continues to rise.
OECD Japan C - Japan (Deviations from Trend)
Fit to text
Scroll horizontally to inspect the labels and values.
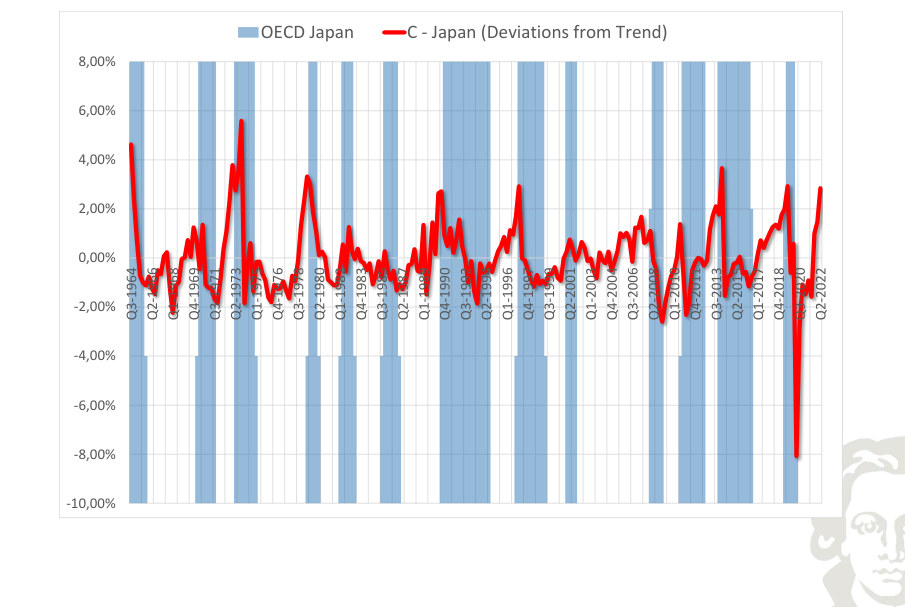
Detrended consumption for Japan highlights movements above and below the estimated long-run path. The horizontal zero line is a normalization relative to the chosen filter, not a literal condition of zero production. Compare the timing and amplitude of these fluctuations with the corresponding output series.
OECD Japan I - Japan
Fit to text
Scroll horizontally to inspect the labels and values.
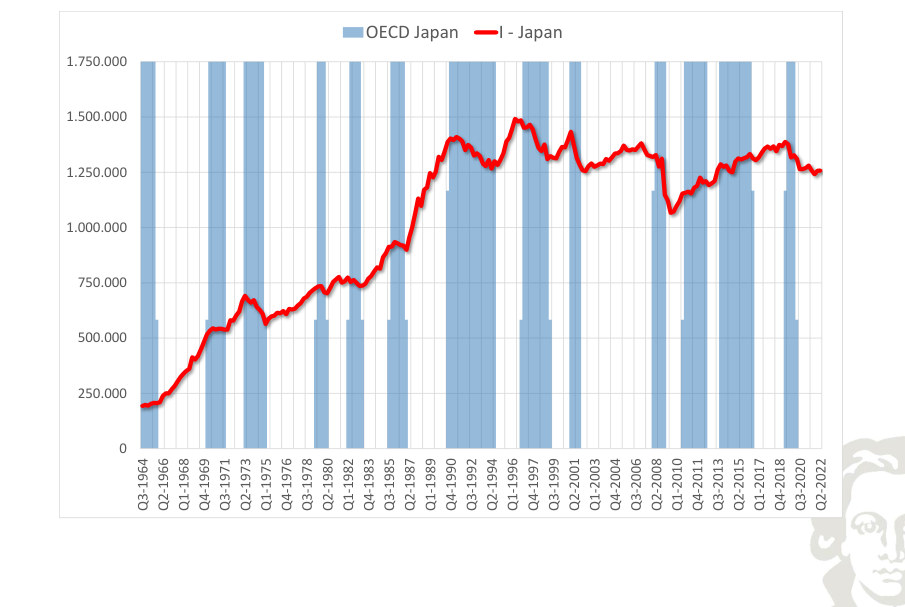
OECD Japan I - Japan (Annual Growth)
Fit to text
Scroll horizontally to inspect the labels and values.
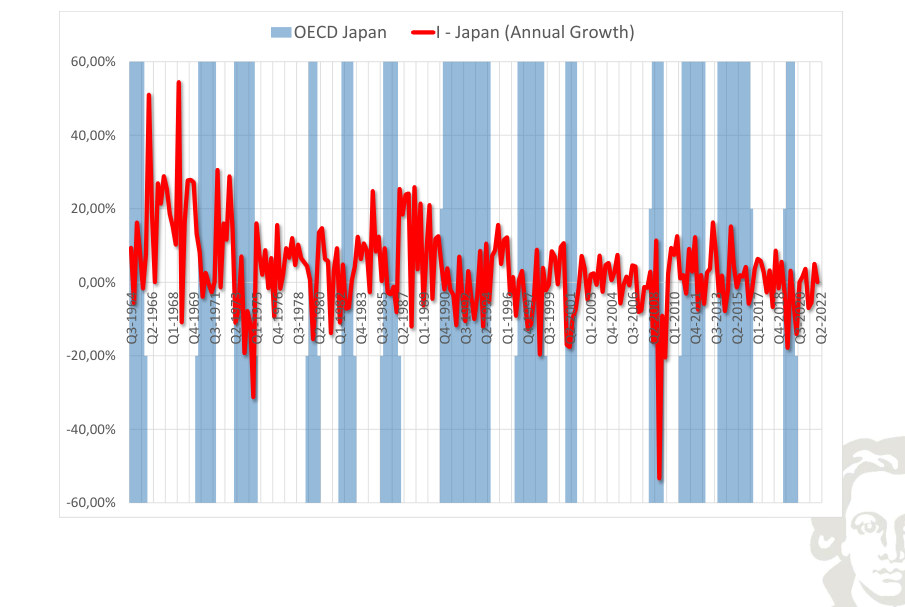
The plotted growth rate of investment for Japan measures the change in activity under the frequency and rate convention of the series. Negative growth and below-trend growth are different concepts; comparing them helps identify contractions without assuming that every slowing constitutes a recession.
OECD Japan I - Japan (Annual Trend Growth)
Fit to text
Scroll horizontally to inspect the labels and values.
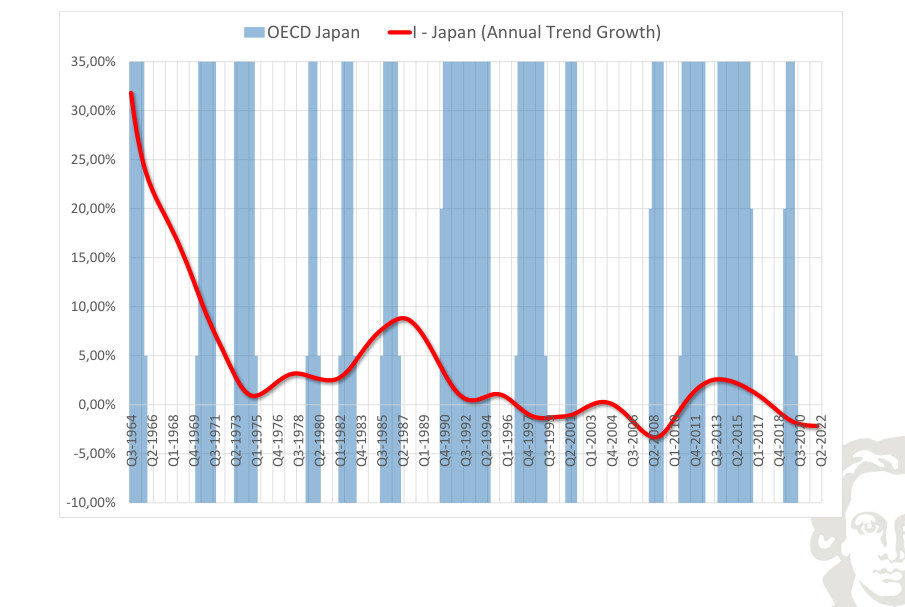
The smoothed growth path of investment in Japan describes the slower-moving change in the rate of expansion. It should not be equated with the cyclical component: the trend-growth series may slow even when the level of activity continues to rise.
OECD Japan I - Japan (Deviations from Trend)
Fit to text
Scroll horizontally to inspect the labels and values.
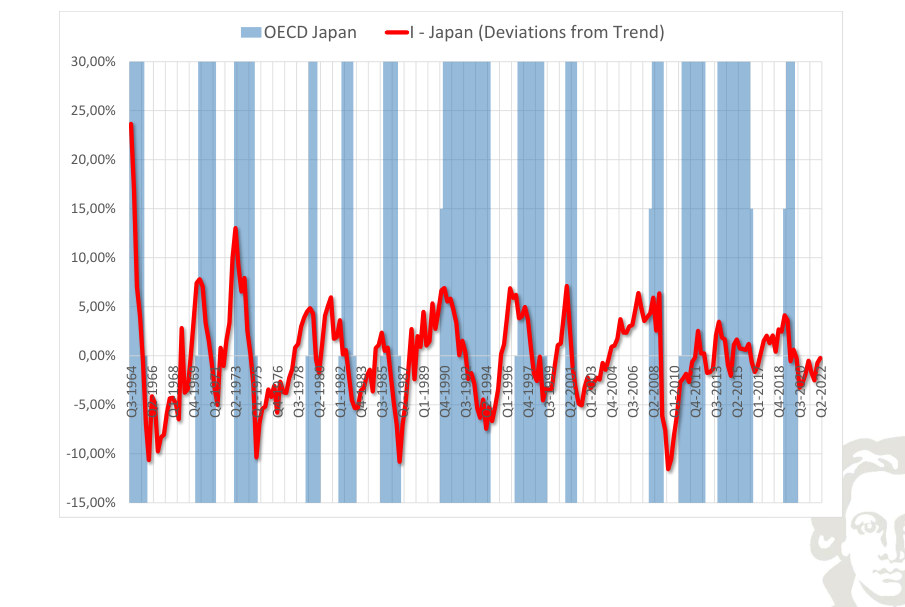
Detrended investment for Japan highlights movements above and below the estimated long-run path. The horizontal zero line is a normalization relative to the chosen filter, not a literal condition of zero production. Compare the timing and amplitude of these fluctuations with the corresponding output series.
OECD Japan G - Japan
Fit to text
Scroll horizontally to inspect the labels and values.
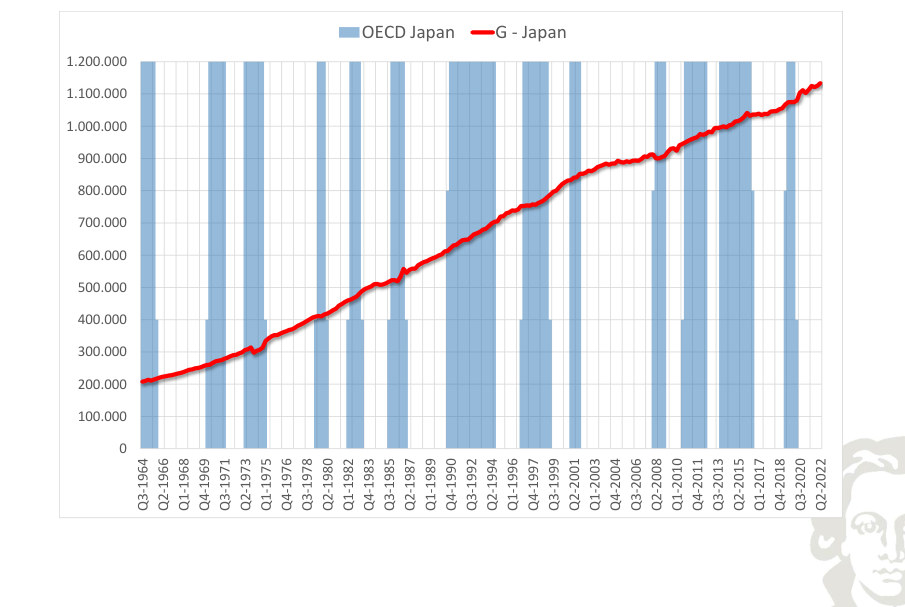
OECD Japan G - Japan (Annual Growth)
Fit to text
Scroll horizontally to inspect the labels and values.
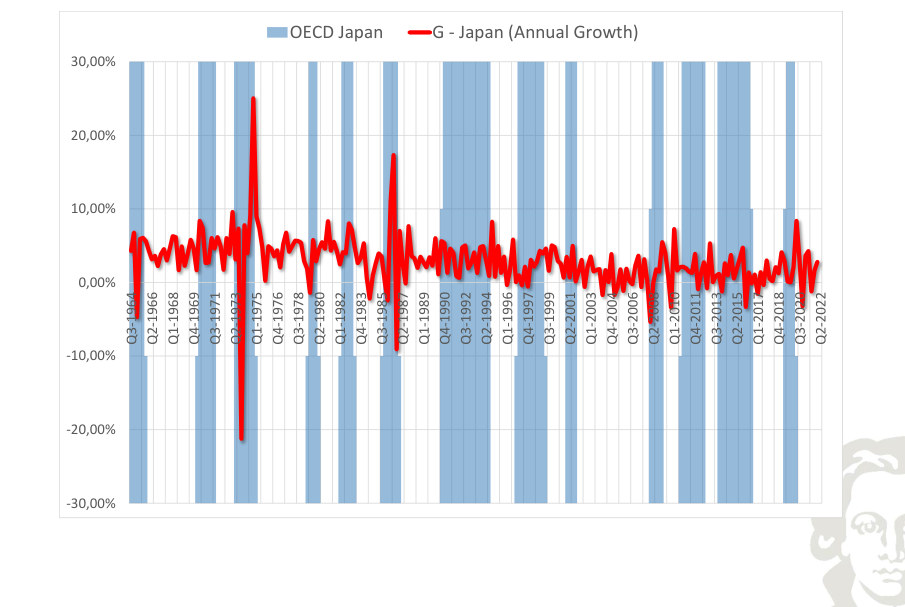
The plotted growth rate of government expenditure for Japan measures the change in activity under the frequency and rate convention of the series. Negative growth and below-trend growth are different concepts; comparing them helps identify contractions without assuming that every slowing constitutes a recession.
OECD Japan G - Japan (Annual Trend Growth)
Fit to text
Scroll horizontally to inspect the labels and values.
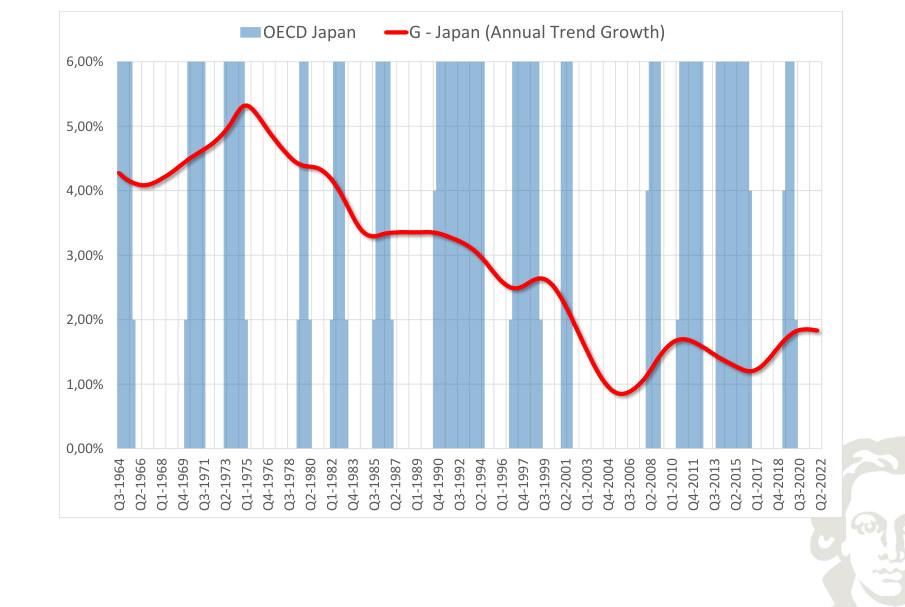
The smoothed growth path of government expenditure in Japan describes the slower-moving change in the rate of expansion. It should not be equated with the cyclical component: the trend-growth series may slow even when the level of activity continues to rise.
OECD Japan G - Japan (Deviations from Trend)
Fit to text
Scroll horizontally to inspect the labels and values.
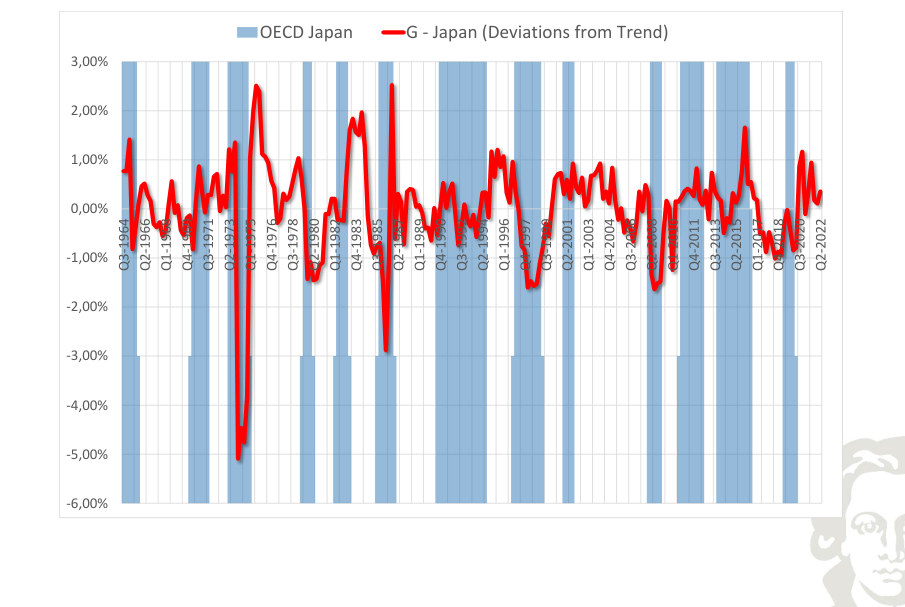
Detrended government expenditure for Japan highlights movements above and below the estimated long-run path. The horizontal zero line is a normalization relative to the chosen filter, not a literal condition of zero production. Compare the timing and amplitude of these fluctuations with the corresponding output series.
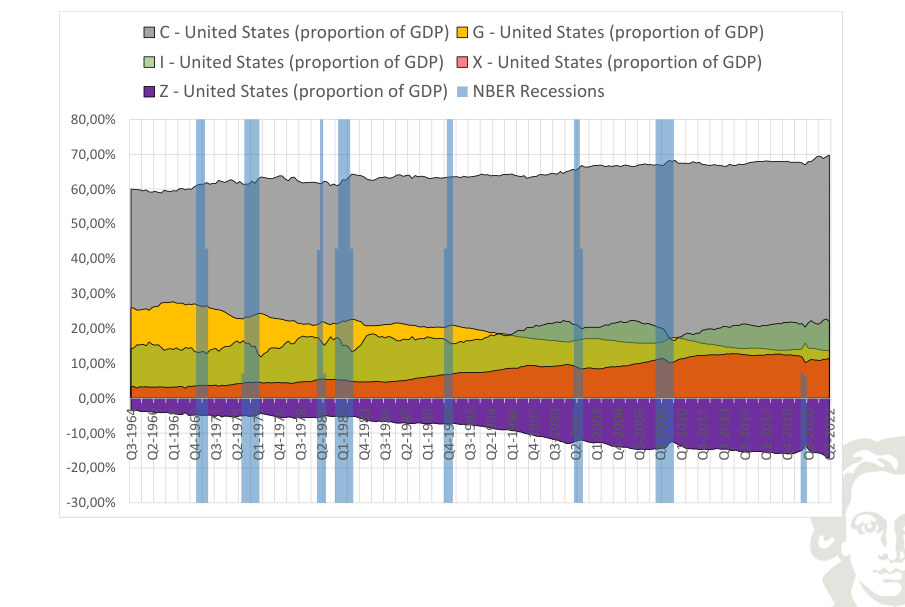
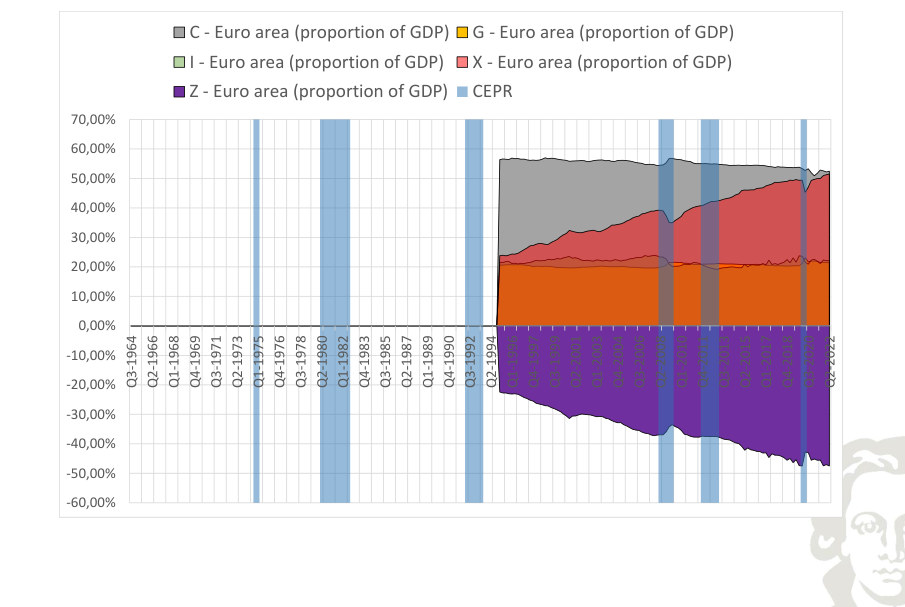
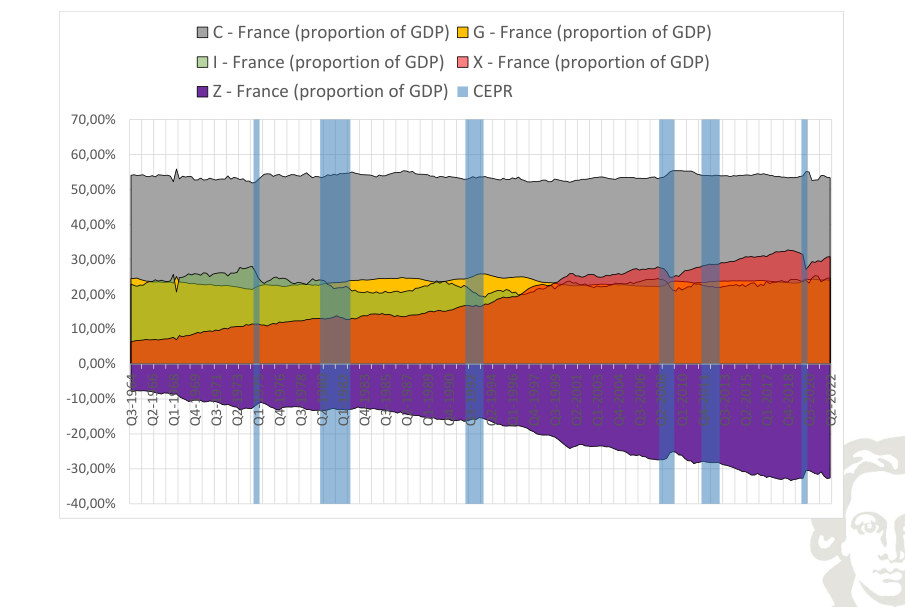
GDP Ratios
Expenditure components can be expressed relative to GDP to compare their importance across time and economies:
Some aggregate expenditure ratios are relatively stable over long horizons. The country plots use OECD data.
C - United States (proportion of GDP) G - United States (proportion of GDP)
Fit to text
Scroll horizontally to inspect the labels and values.
C - Euro area (proportion of GDP) G - Euro area (proportion of GDP)
Fit to text
Scroll horizontally to inspect the labels and values.
C - France (proportion of GDP) G - France (proportion of GDP)
Fit to text
Scroll horizontally to inspect the labels and values.
C - Germany (proportion of GDP) I - Germany (proportion of GDP)
Fit to text
Scroll horizontally to inspect the labels and values.
C - Italy (proportion of GDP) G- Italy (proportion of GDP)
Fit to text
Scroll horizontally to inspect the labels and values.
C - Japan (proportion of GDP) G - Japan (proportion of GDP)
Fit to text
Scroll horizontally to inspect the labels and values.
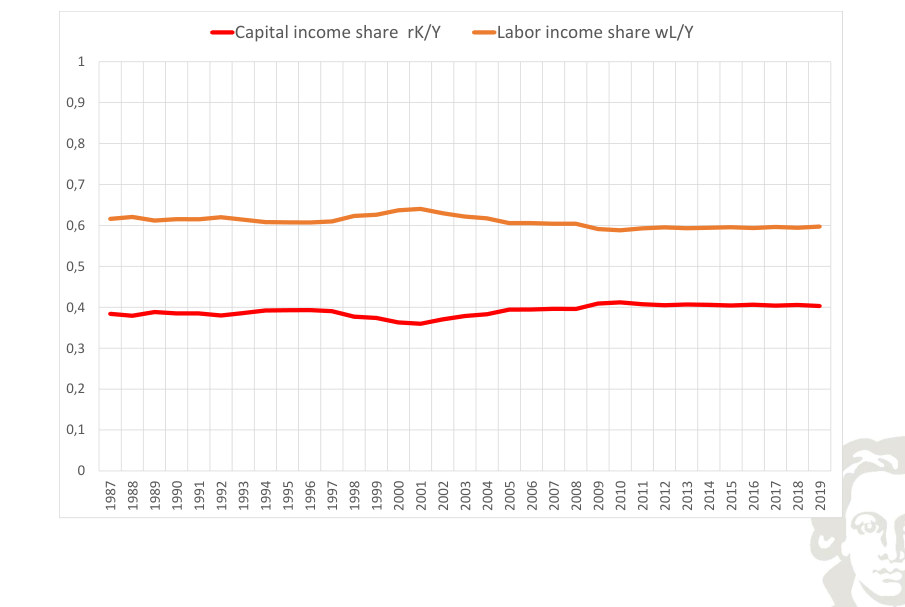
Kaldor Stylized Facts
Balanced growth concerns stable long-run ratios and trends, whereas cyclical statistics describe deviations around those trends. Both are useful targets for a quantitative economic model, but they should not be conflated.
A volatility statistic summarizes the typical amplitude of fluctuations; a correlation describes direction and timing of comovement. Dividing a variable's standard deviation by output's standard deviation produces a scale-free relative volatility. Comparing those moments for simulated and observed data provides a model-diagnostic rather than a proof of causality.
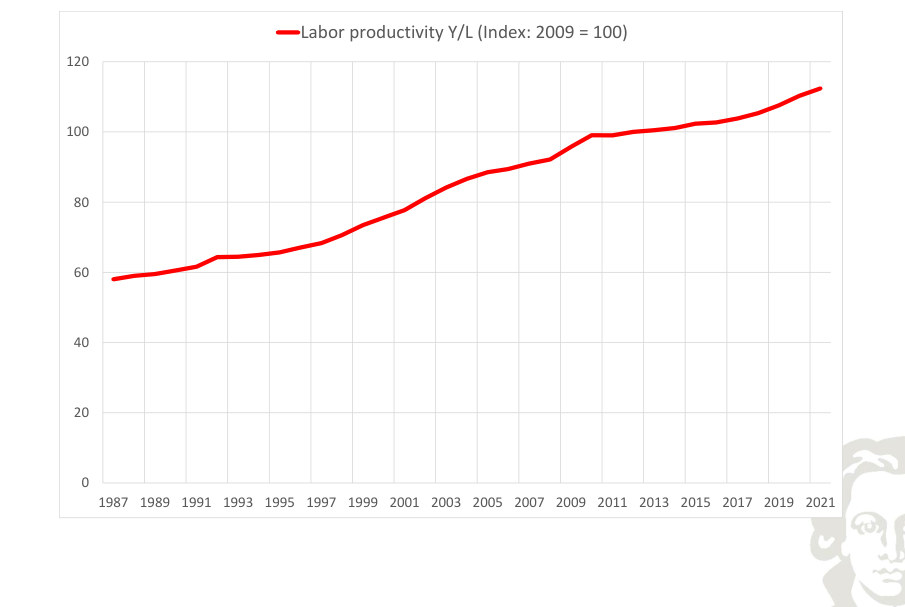
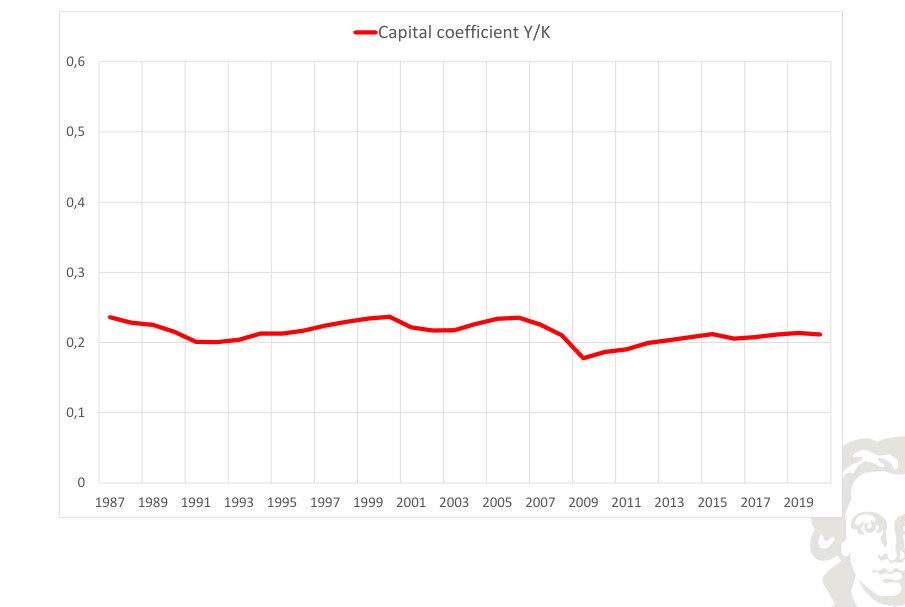
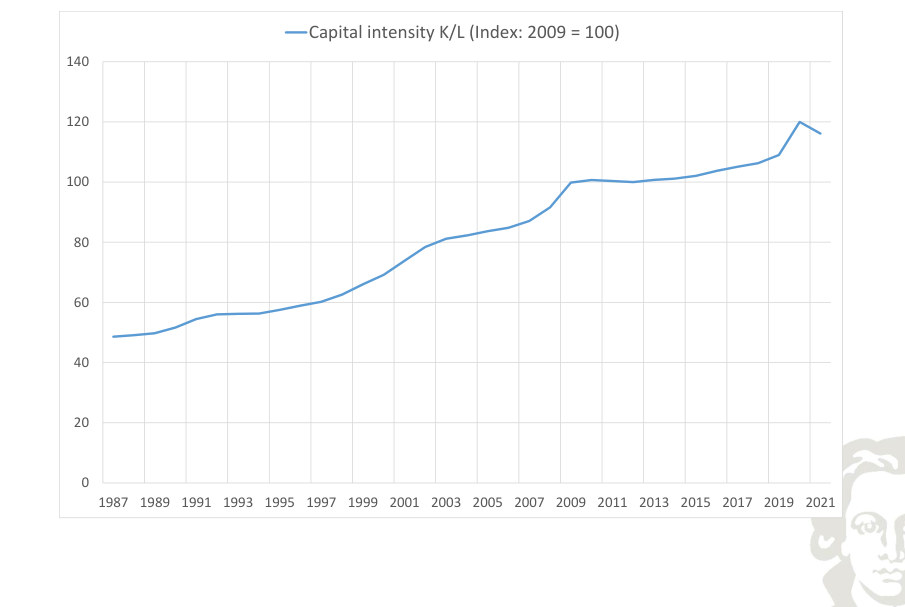
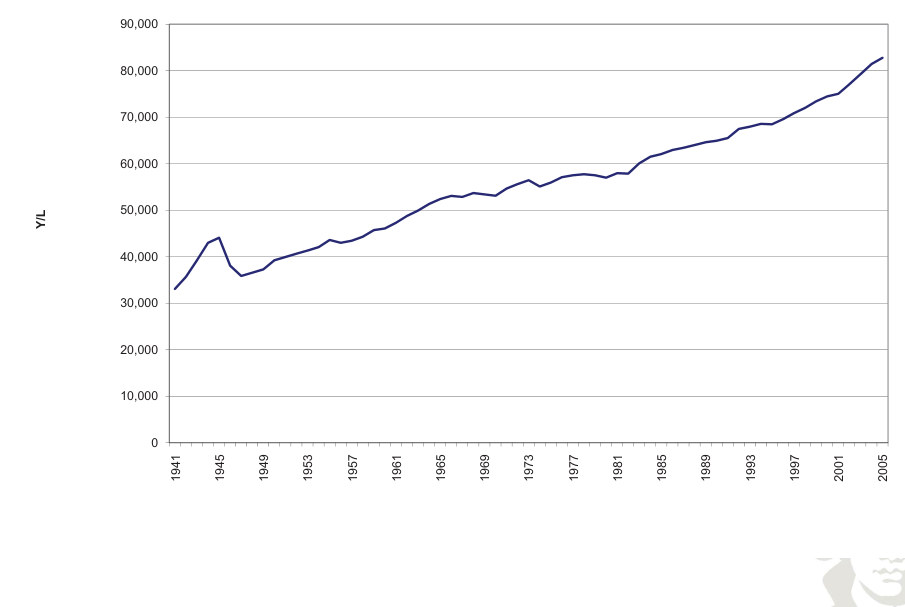
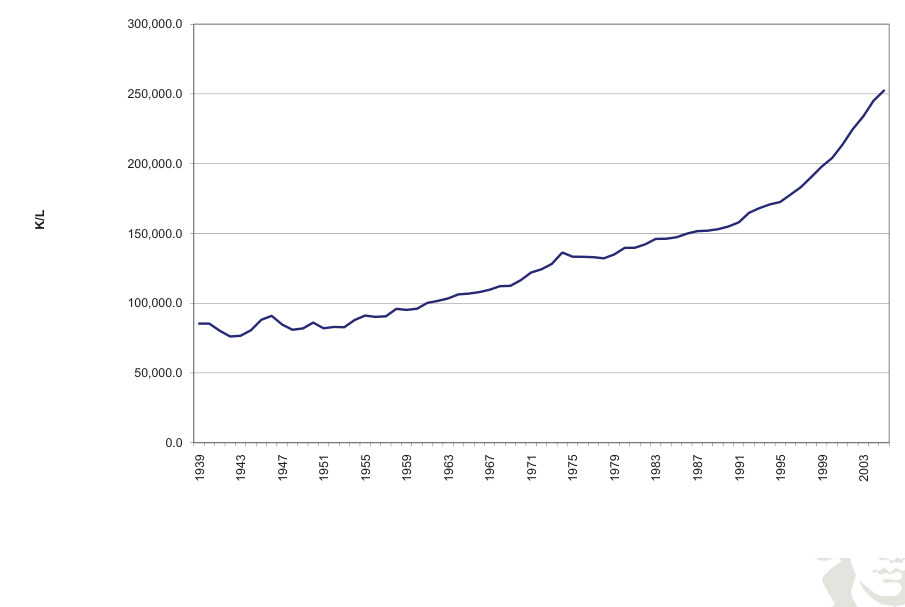
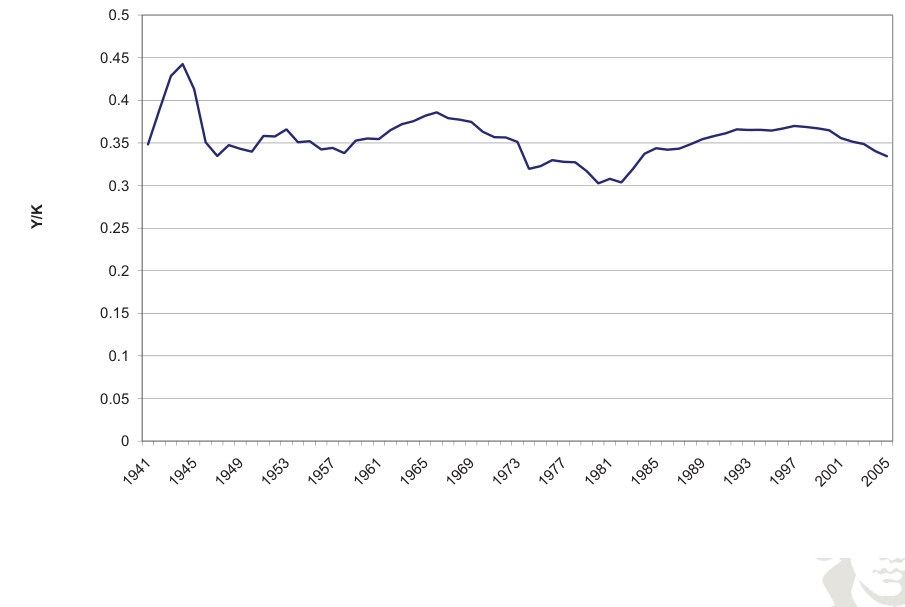
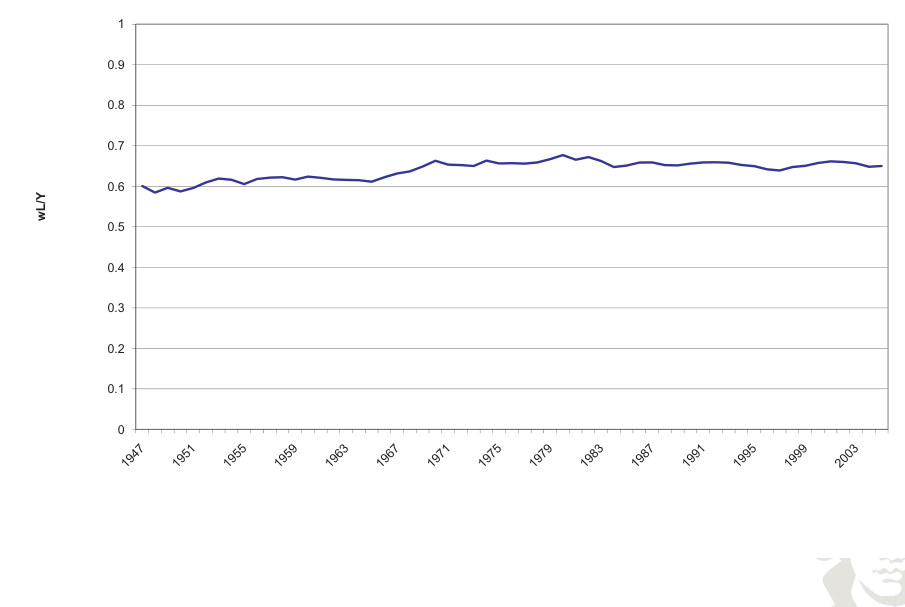
Kaldor’s balanced-growth regularities concern rising output per worker Y/L and capital per worker K/L, a comparatively stable return on capital, a comparatively stable capital–output ratio K/Y, and comparatively stable labor and capital income shares wL/Y and rK/Y. These are long-run regularities rather than exact laws for every sample.
Capital income share rK/Y Labor income share wL/Y
Fit to text
Scroll horizontally to inspect the labels and values.
Labor productivity Y/L (Index: 2009 = 100)
Fit to text
Scroll horizontally to inspect the labels and values.
Capital coefficient Y/K
Fit to text
Scroll horizontally to inspect the labels and values.
Capital intensity K/L (Index: 2009 = 100)
Fit to text
Scroll horizontally to inspect the labels and values.
90,000
Fit to text
Scroll horizontally to inspect the labels and values.
300,000.0
Fit to text
Scroll horizontally to inspect the labels and values.
5
Fit to text
Scroll horizontally to inspect the labels and values.
1
Fit to text
Scroll horizontally to inspect the labels and values.
Solow Model
Capital accumulation creates an intertemporal trade-off: resources devoted to investment raise future productive capacity but reduce resources left for present consumption. In the Solow model the saving fraction is imposed; a steady-state capital stock balances depreciation and effective-labor growth against investment. The Golden Rule savings rate maximizes steady-state consumption, but a structural policy analysis should allow individuals to adjust their saving behavior.
The Solow model expresses output per effective worker as y = k^θ. On its balanced growth path, k and y are constant, while output and capital per worker grow at the rate of labor-augmenting technical progress.
| Quantity | Balanced-growth behavior |
|---|---|
| K/(AL) | Constant |
| Y/(AL) | Constant |
| K/L and Y/L | Grow with A |
| L | Grows with population |
| K and Y | Grow with effective labor AL |
| Y/K | Constant |
In discrete time the gross growth factor of aggregate capital and output is (1+g_A)(1+g_L). The sum g_A+g_L is a first-order approximation. Source: Blanchard and Illing, Macroeconomics, balanced-growth discussion.
Companies
Competitive firms hire capital and labor until their marginal products equal factor prices. With labor-augmenting Cobb–Douglas technology:
A constant capital-to-effective-labor ratio implies a constant capital rental return along the balanced growth path.
Kaldor Facts 5
Competitive Cobb–Douglas factor prices imply labor income wₜLₜ/Yₜ = 1−θ and capital income rₜKₜ₋₁/Yₜ = θ. These constant shares follow from the Cobb–Douglas elasticities together with marginal-product pricing. Constant returns and competition alone imply that factor payments exhaust output; they do not imply constant individual shares for every production function.
Critical Appraisal Of Solow
The Solow model explains growth and capital transition dynamics with an imposed saving rate. It cannot determine how optimal saving changes when taxes, returns or expectations change, because it lacks a household intertemporal optimization problem. This limitation concerns endogenous forward-looking behavior, not the absence of dynamics: the capital accumulation equation is itself dynamic.
Forward-looking households may increase current consumption when they anticipate higher future resources. A model with intertemporal optimization can explain how such expectations influence present saving and consumption.
Decomposing observed macroeconomic data
Data Transformations
Average hours equal total hours divided by employment; labor productivity equals real output divided by hours. A capital series can be built from investment and a stated initial stock using the perpetual-inventory equation:
The initial stock can be independently measured or approximated by i₀/δ under a no-growth steady-state assumption. With Cobb–Douglas production, the log productivity residual is:
The illustrative data construction uses δ = 0.03 and a labor-income share near 0.67. These choices differ from the later benchmark calibration and must remain tied to their respective empirical exercise.
Variability And Correlation
The empirical volatility table above reports log per-capita HP-filtered deviations. Consumption is less volatile than output, while investment is substantially more volatile. Ratios are based on unrounded source moments; dividing the displayed rounded standard deviations may not reproduce every ratio exactly.
Correlation
Empirical cross-correlations of log per-capita HP deviations, corr(Yₜ, xₜ₊ⱼ):
| Series | -3 | -2 | -1 | 0 | 1 | 2 | 3 |
|---|---|---|---|---|---|---|---|
| Output | 0.369 | 0.581 | 0.776 | 1.000 | 0.776 | 0.581 | 0.369 |
| Non-durable consumption | 0.109 | 0.298 | 0.564 | 0.701 | 0.494 | 0.356 | 0.195 |
| Investment | 0.365 | 0.553 | 0.719 | 0.889 | 0.733 | 0.538 | 0.339 |
| Capital | -0.260 | -0.155 | -0.018 | 0.155 | 0.370 | 0.535 | 0.645 |
| Total hours | -0.086 | 0.055 | 0.229 | 0.429 | 0.626 | 0.881 | 0.786 |
| Employment | -0.143 | -0.039 | 0.107 | 0.288 | 0.478 | 0.801 | 0.721 |
| Average hours | 0.333 | 0.512 | 0.678 | 0.772 | 0.684 | 0.581 | 0.414 |
| Labor productivity | 0.136 | 0.049 | -0.065 | -0.244 | -0.418 | -0.475 | -0.500 |
| TFP | 0.471 | 0.627 | 0.753 | 0.875 | 0.550 | 0.301 | 0.055 |
Contemporaneous consumption, investment and TFP are strongly positively correlated with output in this sample. Lead–lag patterns differ across variables.
Synthesis
A model should reproduce clearly defined growth and cyclical facts using appropriately transformed, comparable economic series.